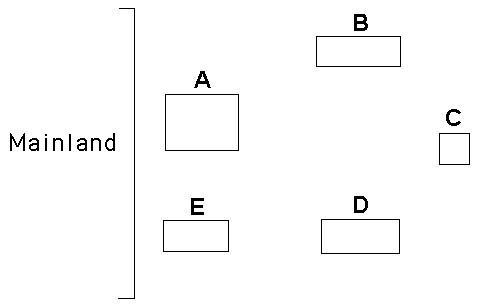
Use the following diagram of five islands formed at around the same
time near a particular mainland, as well as MacArthur and Wilson's
island biogeography principles, to answer the following question.
Figure 54.4
57) Which island would likely
have the lowest extinction rate?
A) A
B) B
C) C
D) D
E) E
A

Use the following diagram of five islands formed at around the same
time near a particular mainland, as well as MacArthur and Wilson's
island biogeography principles, to answer the following question.
Figure 54.4
56) Which island would likely
exhibit the most impoverished species diversity?
A) A
B)
B
C) C
D) D
E) E
C

Use the following diagram of five islands formed at around the same
time near a particular mainland, as well as MacArthur and Wilson's
island biogeography principles, to answer the following question.
Figure 54.4
55) Which island would likely
have the greatest species diversity?
A) A
B) B
C) C
D) D
E) E
A

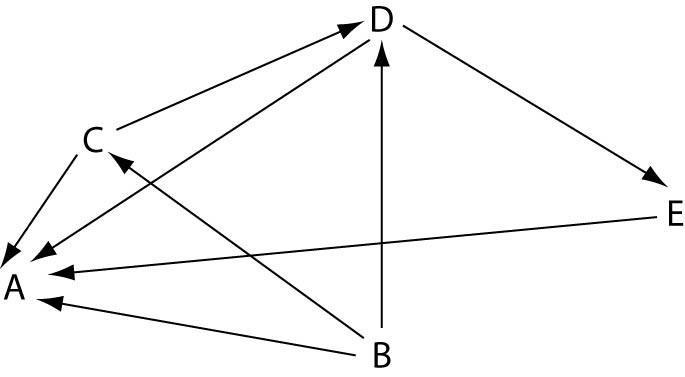
Use the following diagram of a hypothetical food web to answer the
following question. The arrows represent the transfer of food energy
between the various trophic levels.
Figure 54.3
54) Which letter represents an organism that could be a primary
consumer?
A) A
B) B
C) C
D) D
E) E
C
Use the following diagram of a hypothetical food web to answer the
following question. The arrows represent the transfer of food energy
between the various trophic levels.
Figure 54.3
53) Which letter represents an organism that could be a
producer?
A) A
B) B
C) C
D) D
E) E
B

Use the following diagram of a hypothetical food web to answer the
following question. The arrows represent the transfer of food energy
between the various trophic levels.
Figure 54.3
52) Which letter represents an organism that could be a
carnivore?
A) A
B) B
C) C
D) D
E) E
E

50) Connell conducted this experiment to learn more about
A)
character displacement in the color of barnacles.
B) habitat
preference in two different species of barnacles.
C) desiccation
resistance and barnacle species.
D) how sea-level changes affect
barnacle distribution.
E) competitive exclusion and distribution
of barnacle species.
competitive exclusion and distribution of barnacle species.
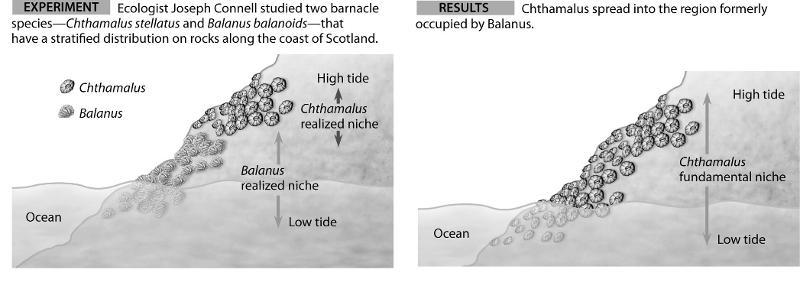
49) Which of the following statements is a valid conclusion of this
experiment?
A) Balanus can only survive in the lower intertidal
zone, because it is unable to resist desiccation.
B) Balanus is
inferior to Chthamalus in competing for space on intertidal zone
rocks.
C) The two species of barnacles do not compete with each
other because they feed at different times of day.
D) When
Balanus is removed, it can be observed that the realized niche of
Chthamalus is smaller than its fundamental niche.
E) These two
species of barnacle do not show competitive exclusion.
F) If
Chthamalus were removed, Balanus's fundamental niche would become larger.
When Balanus is removed, it can be observed that the realized niche of Chthamalus is smaller than its fundamental niche.

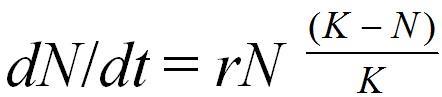
25) Logistic growth of a population is represented by dN/dt =
A. SEE IMAGE
B. SEE IMAGE
C. SEE IMAGE
D. SEE
IMAGE
E. SEE IMAGE
D

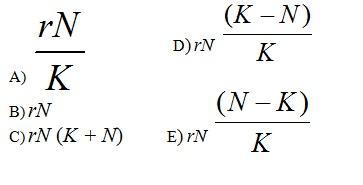
39) Often the growth cycle of one population has an effect on the
cycle of another. As moose populations increase, for example, wolf
populations also increase. Thus, if we are considering the logistic
equation for the wolf population,
SEE IMAGE
which of the factors accounts for the effect on the moose
population?
A) r
B) N
C) rN
D) K
E) dt
K

51) Which curve best describes survivorship in marine molluscs?
A) A
B) B
C) C
D) D
E) E
E

52) Which curve best describes survivorship in elephants?
A) A
B) B
C) C
D) D
E) E
A

53) Which curve best describes survivorship in a marine crustacean
that molts?
A) A
B) B
C) C
D) D
E) E
D
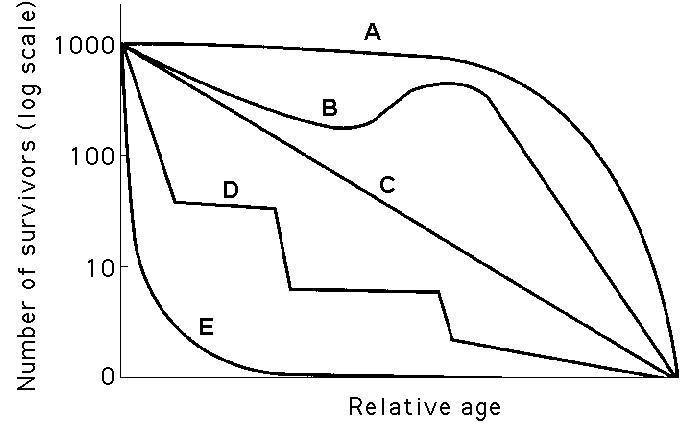
54) Which curve best describes survivorship in humans who live in
undeveloped nations?
A) A
B) B
C) C
D) D
E) E
A

55) Which statement best explains survivorship curve B?
A) It
is likely a species that provides little postnatal care, but lots of
care for offspring during midlife as indicated by increased
survivorship.
B) This curve is likely of a species that produces
lots of offspring, only a few of which are expected to survive.
C) It is likely a species where no individuals in the cohort die
when they are at 60—70% relative age.
D) There was a mass
emigration of young to middle-aged individuals in this cohort.
E) Survivorship can only decrease; therefore, this curve could
not happen in nature.
Survivorship can only decrease; therefore, this curve could not happen in nature.
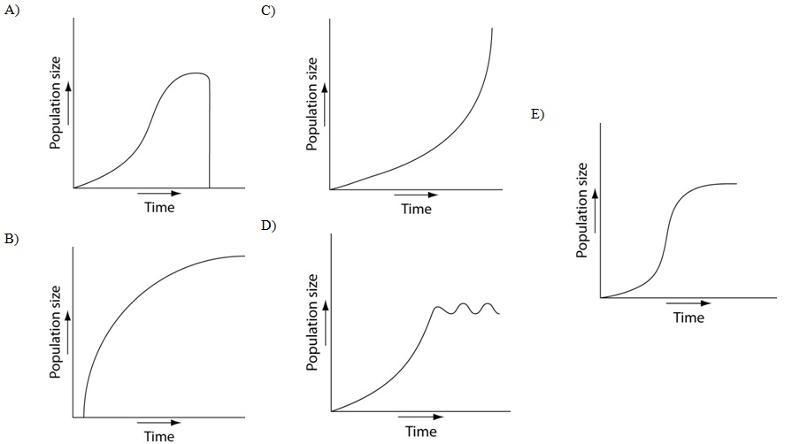
56) Which of the following graphs illustrates the population growth
curve of single bacterium growing in a flask of ideal medium at
optimum temperature over a 24-hour period?
A. SEE IMAGE
B. SEE IMAGE
C. SEE IMAGE
D. SEE IMAGE
E. SEE IMAGE
C

57) Which of the following graphs illustrates the growth curve of a small population of rodents that has grown to reach a static carrying capacity?
A. SEE IMAGE
B. SEE IMAGE
C. SEE IMAGE
D. SEE
IMAGE
E. SEE IMAGE
E

59) Which of the following is a likely graphic outcome of a
population of deer introduced to an island with an adequate herbivory
and without natural predators, parasites, or disease?
A.
SEE IMAGE
B. SEE IMAGE
C. SEE IMAGE
D. SEE IMAGE
E. SEE IMAGE
A

60) Which of the following graphs illustrates the growth over several seasons of a population of snowshoe hares that were introduced to an appropriate habitat also inhabited by predators in northern Canada?
A. SEE IMAGE
B. SEE IMAGE
C. SEE IMAGE
D. SEE
IMAGE
E. SEE IMAGE
D
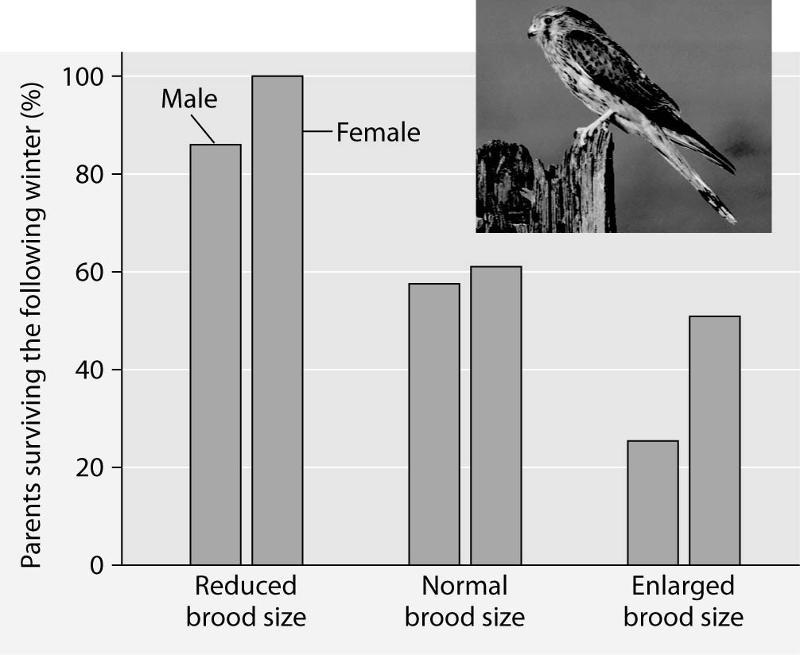
Please read the paragraph below and review Figure 53.2 to answer the
following question.
Researchers in the Netherlands
studied the effects of parental care given in European kestrels over
five years. The researchers transferred chicks among nests to produce
reduced broods (three or four chicks), normal broods (five or six
chicks), and enlarged broods (seven or eight chicks). They then
measured the percentage of male and female parent birds that survived
the following winter. (Both males and females provide care for
chicks.)
Figure 53.2: Brood size manipulations in the
kestrel: Effects on offspring and parent survival.
58)
Which of the following is a conclusion that can be drawn from this
graph?
A) Female survivability is more negatively affected by
larger brood size than is male survivability.
B) Male
survivability decreased by 50% between reduced and enlarged brood
treatments.
C) Both males and females had increases in daily
hunting with the enlarged brood size.
D) There appears to be a
negative correlation between brood enlargements and parental survival.
E) Chicks in reduced brood treatment received more food, weight
gain, and reduced mortality.
There appears to be a negative correlation between brood enlargements and parental survival.
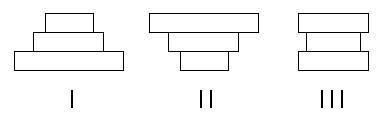
The following questions refer to Figure 53.3, which depicts the age
structure of three populations.
61) Which population(s)
is (are) in the process of decreasing?
A) I
B) II
C) III
D) I and II
E) II and III
II

The following questions refer to Figure 53.3, which depicts the age
structure of three populations.
62) Which population(s)
appear(s) to be stable?
A) I
B) II
C) III
D)
I and II
E) II and III
III

The following questions refer to Figure 53.3, which depicts the age
structure of three populations.
63) Assuming these
age-structure diagrams describe human populations, in which
population is unemployment likely to be a societal issue in the
future?
A) I
B) II
C) III
D) No differences
in the magnitude of future unemployment would be expected among these
populations.
E) It is not possible to infer anything about
future social conditions from age-structure diagrams.
I

The following questions refer to Figure 53.3, which depicts the age
structure of three populations.
64) Assuming these
age-structure diagrams describe human populations, which population(s)
is (are) likely to experience zero population growth (ZPG)?
A) I
B) II
C) III
D) I and II
E) II and III
III

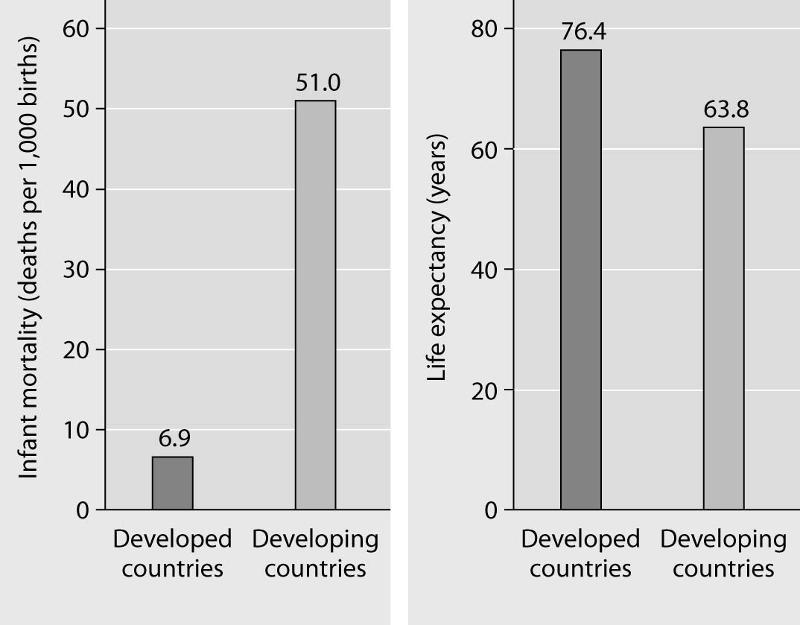
Refer to Figure 53.4 and then answer the following questions.
Figure 53.4: Infant mortality and life expectancy at birth in
developed and developing countries (data as of 2005).
65)
What is a logical conclusion that can be drawn from the graphs above?
A) Developed countries have lower infant mortality rates and
lower life expectancy than developing countries.
B) Developed
countries have higher infant mortality rates and lower life expectancy
than developing countries.
C) Developed countries have lower
infant mortality rates and higher life expectancy than developing
countries.
D) Developed countries have higher infant mortality
rates and higher life expectancy than developing countries.
E)
Developed countries have a life expectancy that is about 42 years more
than life expectancy in developing countries.
Developed countries have lower infant mortality rates and higher life expectancy than developing countries.
Refer to Figure 53.4 and then answer the following questions.
Figure 53.4: Infant mortality and life expectancy at birth in
developed and developing countries (data as of 2005).
66)
In terms of demographics, which country is likely to experience the
greatest population growth problem over the next ten years?
A)
Mexico, because there are fewer pre-reproductive individuals in their
population
B) China, whose population is more than a billion,
but whose expected fertility rate is 1.8 children
C) Germany,
where the growth rate of the population is 0.1% per year
D)
United States (2009 population ~ 205,000,000, where 200,000 Americans
are added to the population each day)
E) Afghanistan, with a
3.85 annual growth rate
Afghanistan, with a 3.85 annual growth rate
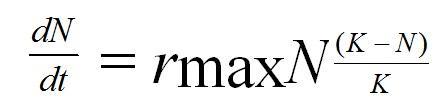
76) According to the logistic growth equation
SEE IMAGE
A) the number of individuals added per unit time is
greatest when N is close to zero.
B) the per capita growth rate
(r) increases as N approaches K.
C) population growth is zero
when N equals K.
D) the population grows exponentially when K is
small.
E) the birth rate (b) approaches zero as N approaches K.
population growth is zero when N equals K.

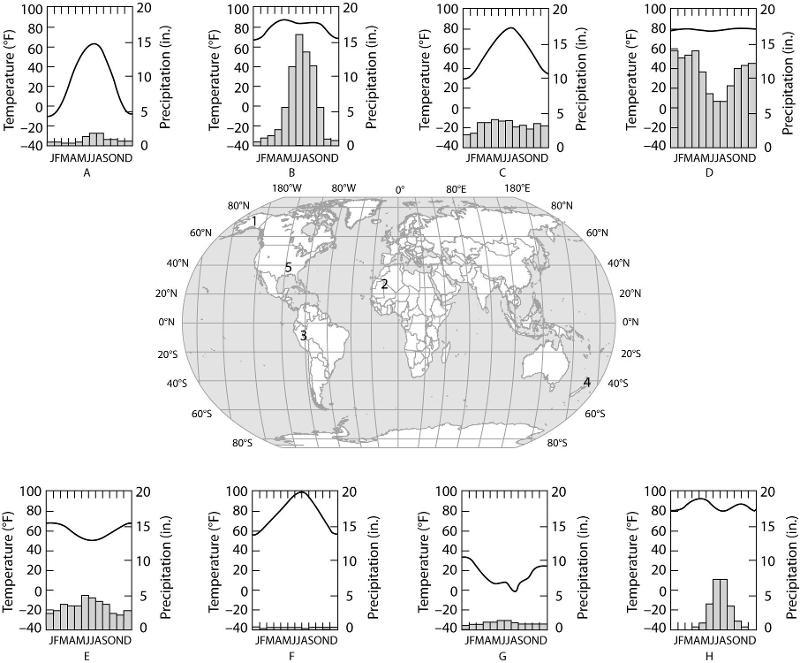
The eight climographs below show yearly temperature (line graph and
left vertical axis) and precipitation (bar graph and right vertical
axis) averages for each month for some locations on Earth. Choose the
climograph that best answers the question or completes the statement.
Climographs may be used once, more than once, or not at all.
50) Which climograph shows the climate for location 1?
A)
A
B) C
C) E
D) G
E) H
A

The eight climographs below show yearly temperature (line graph and
left vertical axis) and precipitation (bar graph and right vertical
axis) averages for each month for some locations on Earth. Choose the
climograph that best answers the question or completes the statement.
Climographs may be used once, more than once, or not at all.
51) Which climograph shows the climate for location 2?
A)
B
B) C
C) D
D) F
E) H
F

The eight climographs below show yearly temperature (line graph and
left vertical axis) and precipitation (bar graph and right vertical
axis) averages for each month for some locations on Earth. Choose the
climograph that best answers the question or completes the statement.
Climographs may be used once, more than once, or not at all.
52) Which climograph shows the climate for location 3?
A)
B
B) C
C) D
D) E
E) F
D

The eight climographs below show yearly temperature (line graph and
left vertical axis) and precipitation (bar graph and right vertical
axis) averages for each month for some locations on Earth. Choose the
climograph that best answers the question or completes the statement.
Climographs may be used once, more than once, or not at all.
53) Which climograph shows the climate for location 4?
A)
A
B) B
C) C
D) E
E) G
E
The eight climographs below show yearly temperature (line graph and
left vertical axis) and precipitation (bar graph and right vertical
axis) averages for each month for some locations on Earth. Choose the
climograph that best answers the question or completes the statement.
Climographs may be used once, more than once, or not at all.
54) Which climograph shows the climate for location 5?
A)
A
B) C
C) D
D) E
E) H
C

The eight climographs below show yearly temperature (line graph and
left vertical axis) and precipitation (bar graph and right vertical
axis) averages for each month for some locations on Earth. Choose the
climograph that best answers the question or completes the statement.
Climographs may be used once, more than once, or not at all.
55) Which of the following best substantiates why location 3 is
an equatorial (tropical) climate?
A) It has a monsoon season
during the winter months.
B) It has consistent monthly averages
for rainfall.
C) The temperature is high for each monthly
average.
D) The temperatures reach 100°F during some months.
E) The temperatures are lower in June, July, and August.
The temperature is high for each monthly average.

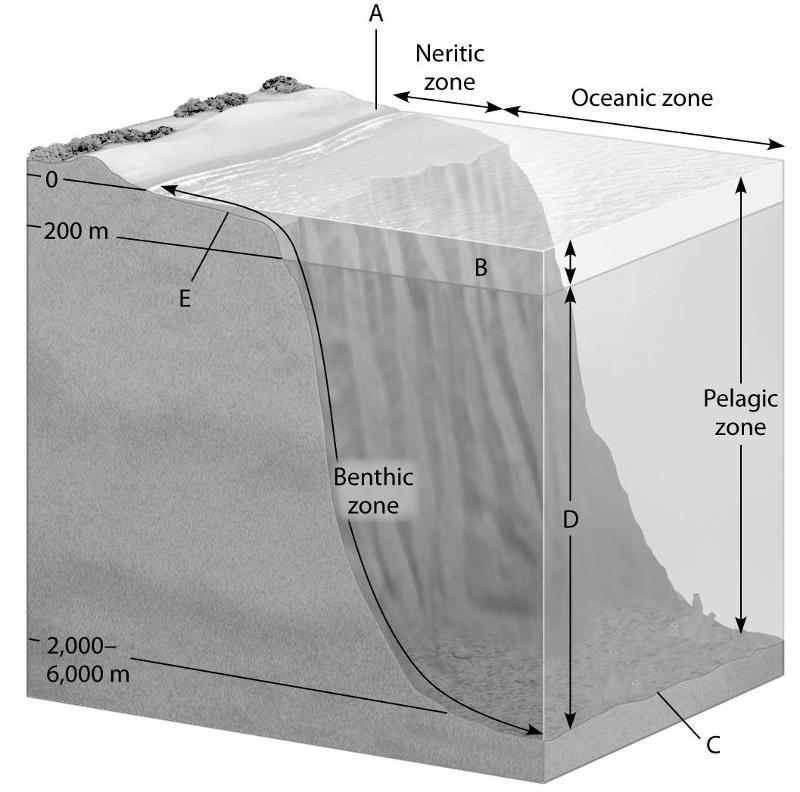
The diagram shows a generalized cross section of the marine
environment with various zones labeled with letters. Choose the letter
that best answers the question. Letters may be used once, more than
once, or not at all
56) Which zone has a condition of constant temperature?
A)
A
B) B
C) C
D) D
E) E
C

The diagram shows a generalized cross section of the marine
environment with various zones labeled with letters. Choose the letter
that best answers the question. Letters may be used once, more than
once, or not at all
57) Which zone produces the most global oxygen gas?
A) A
B) B
C) C
D) D
E) E
B

The diagram shows a generalized cross section of the marine
environment with various zones labeled with letters. Choose the letter
that best answers the question. Letters may be used once, more than
once, or not at all
58) Which zone is comprised largely of detritus-feeding
organisms?
A) A
B) B
C) C
D) D
E) E
C
The diagram shows a generalized cross section of the marine
environment with various zones labeled with letters. Choose the letter
that best answers the question. Letters may be used once, more than
once, or not at all
59) Which zone has the lowest biomass per unit of area?
A)
A
B) B
C) C
D) D
E) E
D

The diagram shows a generalized cross section of the marine
environment with various zones labeled with letters. Choose the letter
that best answers the question. Letters may be used once, more than
once, or not at all
60) Which zone experiences the most abiotic change over a
24-hour period?
A) A
B) B
C) C
D) D
E) E
A
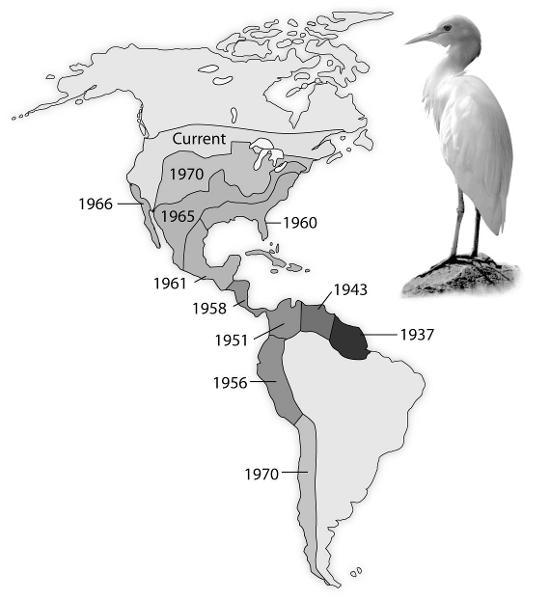
Use the following diagram from the text showing the spread of the
cattle egret, Bubulcus ibis, since its arrival in the New World, to
answer the following question.
61) How would an ecologist likely explain the expansion of the
cattle egret?
A) The areas to which the cattle egret has
expanded have no cattle egret parasites.
B) Climatic factors,
such as temperature and precipitation, provide a suitable habitat for
cattle egrets.
C) There are no predators for cattle egrets in
the New World, so they continue to expand their range.
D) A
habitat left unoccupied by native herons and egrets met the biotic and
abiotic requirements of the cattle egret transplants and their
descendants.
E) The first egrets to colonize South America
evolved into a new species capable of competing with the native
species of herons and egrets.
A habitat left unoccupied by native herons and egrets met the biotic and abiotic requirements of the cattle egret transplants and their descendants.
19) Exponential growth of a population is represented by dN/dt =
A. SEE IMAGE
B. SEE IMAGE
C. SEE IMAGE
D. SEE
IMAGE
E. SEE IMAGE
rN
76) According to the logistic growth equation
SEE IMAGE
A) the number of individuals added per unit time is greatest
when N is close to zero.
B) the per capita growth rate (r)
increases as N approaches K.
C) population growth is zero when N
equals K.
D) the population grows exponentially when K is small.
E) the birth rate (b) approaches zero as N approaches K.
population growth is zero when N equals K

49) Which of the following statements is a valid conclusion of this
experiment?
A) Balanus can only survive in the lower intertidal
zone, because it is unable to resist desiccation.
B) Balanus is
inferior to Chthamalus in competing for space on intertidal zone
rocks.
C) The two species of barnacles do not compete with each
other because they feed at different times of day.
D) When
Balanus is removed, it can be observed that the realized niche of
Chthamalus is smaller than its fundamental niche.
E) These two
species of barnacle do not show competitive exclusion.
F) If
Chthamalus were removed, Balanus's fundamental niche would become larger.
When Balanus is removed, it can be observed that the realized niche of Chthamalus is smaller than its fundamental niche

50) Connell conducted this experiment to learn more about
A)
character displacement in the color of barnacles.
B) habitat
preference in two different species of barnacles.
C) desiccation
resistance and barnacle species.
D) how sea-level changes affect
barnacle distribution.
E) competitive exclusion and distribution
of barnacle species.
competitive exclusion and distribution of barnacle species.
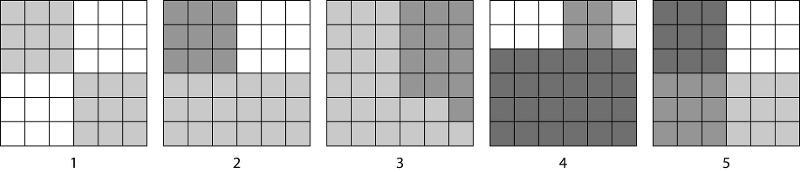
51) According to the Shannon Diversity Index, which block would show
the greatest diversity?
A) 1
B) 2
C) 3
D) 4
E) 5
5
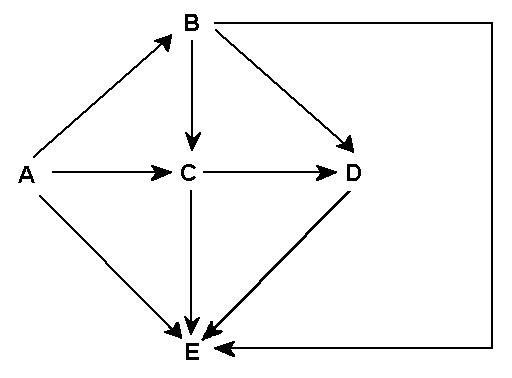
Food web for a particular terrestrial ecosystem (arrows represent
energy flow and letters represent species)
61) Examine this food web for a particular terrestrial
ecosystem. Which species is autotrophic?
A) A
B) B
C) C
D) D
E) E
A

Food web for a particular terrestrial ecosystem (arrows represent
energy flow and letters represent species)
62) Examine this food web for a particular terrestrial
ecosystem. Which species is most likely a decomposer on this food web?
A) A
B) B
C) C
D) D
E) E
E

Food web for a particular terrestrial ecosystem (arrows represent
energy flow and letters represent species)
63) Examine this food web for a particular terrestrial
ecosystem. Species C is toxic to predators. Which species is most
likely to benefit from being a mimic of C?
A) A
B) B
C) C
D) D
E) E
B

Food web for a particular terrestrial ecosystem (arrows represent
energy flow and letters represent species)
64) Examine this food web for a particular terrestrial
ecosystem. Which pair of species could be omnivores?
A) A and B
B) A and D
C) B and C
D) C and D
E) C and E
C and E

Diagram of a food web (arrows represent energy flow and letters
represent species)
65) If the figure above represents a terrestrial food web, the
combined biomass of C + D would probably be
A) greater than the
biomass of A.
B) less than the biomass of H.
C) greater
than the biomass of B.
D) less than the biomass of A + B.
E) less than the biomass of E.
less than the biomass of A + B.
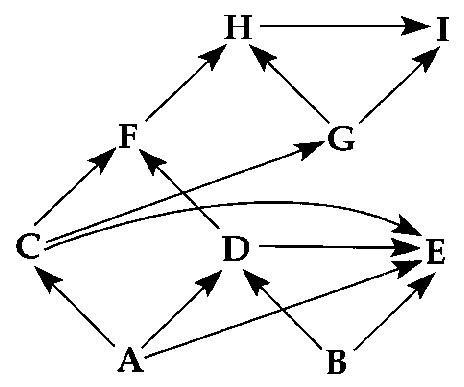
Diagram of a food web (arrows represent energy flow and letters
represent species)
66) If the figure above represents a marine food web, the
smallest organism might be
A) A.
B) F.
C) C.
D) I.
E) E.
A

67) On the diagram of the nitrogen cycle, which number represents
nitrite (NO₂)?
A) 1
B) 2
C) 3
D) 4
3
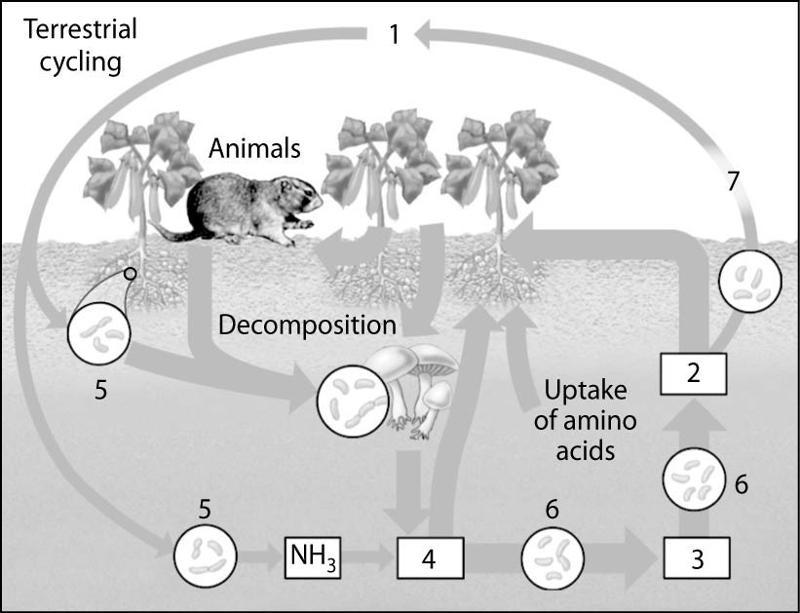
68) On the diagram of the nitrogen cycle, which number represents
ammonia (NH₄+)?
A) 1
B) 2
C) 3
D) 4
4

69) On the diagram of the nitrogen cycle, which number represents
nitrogen-fixing bacteria?
A) 5
B) 6
C) 7
5

70) On the diagram of the nitrogen cycle, which number represents
nitrifying bacteria?
A) 5
B) 6
C) 7
6