Instructions for Side by Side Printing
- Print the notecards
- Fold each page in half along the solid vertical line
- Cut out the notecards by cutting along each horizontal dotted line
- Optional: Glue, tape or staple the ends of each notecard together
BSC 1011 pictures
front 1 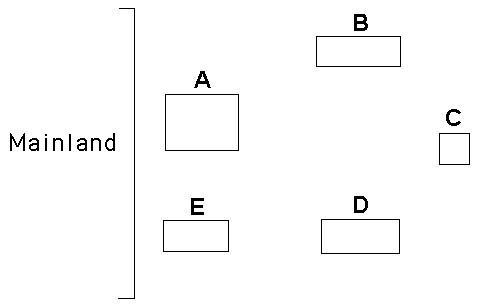 Use the following diagram of five islands formed at around the same
time near a particular mainland, as well as MacArthur and Wilson's
island biogeography principles, to answer the following question.
| back 1 A |
front 2  Use the following diagram of five islands formed at around the same
time near a particular mainland, as well as MacArthur and Wilson's
island biogeography principles, to answer the following question.
| back 2 C |
front 3  Use the following diagram of five islands formed at around the same
time near a particular mainland, as well as MacArthur and Wilson's
island biogeography principles, to answer the following question.
| back 3 A |
front 4  Use the following diagram of a hypothetical food web to answer the
following question. The arrows represent the transfer of food energy
between the various trophic levels. | back 4 C |
front 5 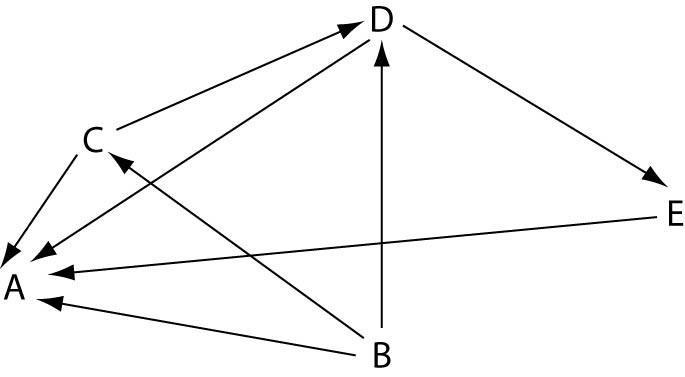 Use the following diagram of a hypothetical food web to answer the
following question. The arrows represent the transfer of food energy
between the various trophic levels. | back 5 B |
front 6  Use the following diagram of a hypothetical food web to answer the
following question. The arrows represent the transfer of food energy
between the various trophic levels. | back 6 E |
front 7  50) Connell conducted this experiment to learn more about | back 7 competitive exclusion and distribution of barnacle species. |
front 8 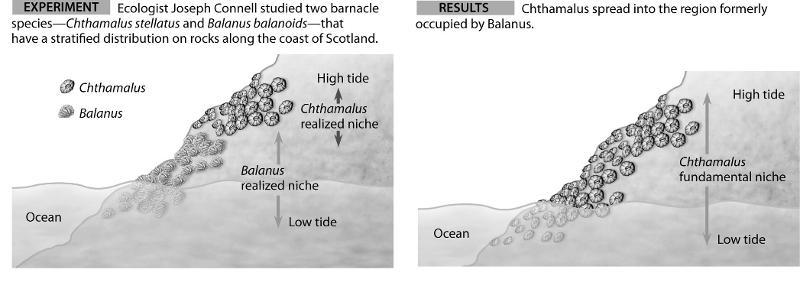 49) Which of the following statements is a valid conclusion of this
experiment? | back 8 When Balanus is removed, it can be observed that the realized niche of Chthamalus is smaller than its fundamental niche. |
front 9  25) Logistic growth of a population is represented by dN/dt = | back 9 D |
front 10  39) Often the growth cycle of one population has an effect on the
cycle of another. As moose populations increase, for example, wolf
populations also increase. Thus, if we are considering the logistic
equation for the wolf population, | back 10 K |
front 11  51) Which curve best describes survivorship in marine molluscs?
| back 11 E |
front 12  52) Which curve best describes survivorship in elephants? | back 12 A |
front 13  53) Which curve best describes survivorship in a marine crustacean
that molts? | back 13 D |
front 14 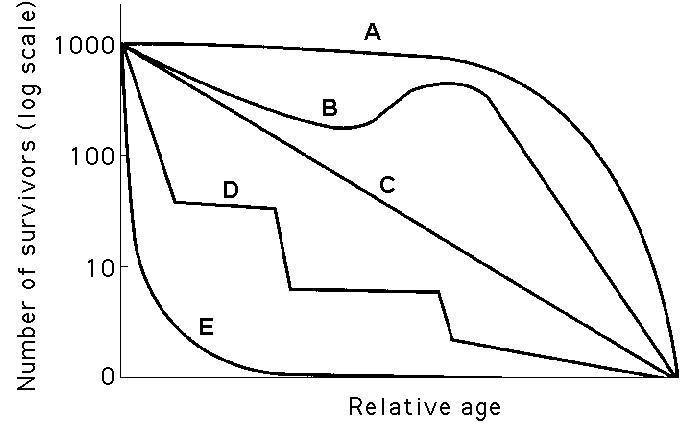 54) Which curve best describes survivorship in humans who live in
undeveloped nations? | back 14 A |
front 15  55) Which statement best explains survivorship curve B? | back 15 Survivorship can only decrease; therefore, this curve could not happen in nature. |
front 16 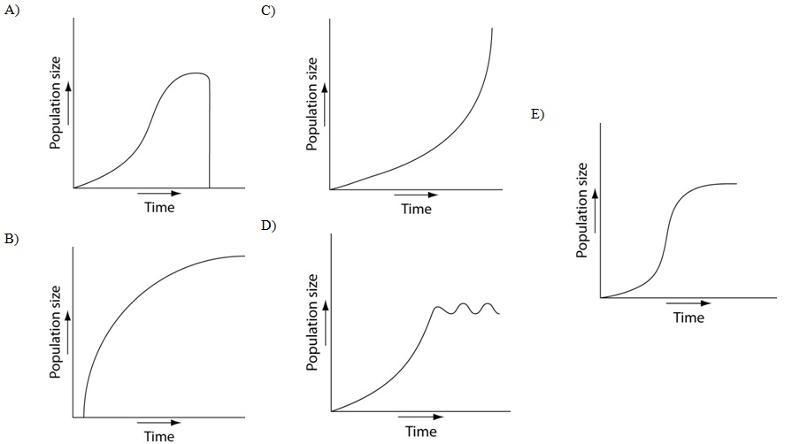 56) Which of the following graphs illustrates the population growth
curve of single bacterium growing in a flask of ideal medium at
optimum temperature over a 24-hour period? | back 16 C |
front 17  57) Which of the following graphs illustrates the growth curve of a small population of rodents that has grown to reach a static carrying capacity? A. SEE IMAGE | back 17 E |
front 18  59) Which of the following is a likely graphic outcome of a
population of deer introduced to an island with an adequate herbivory
and without natural predators, parasites, or disease? | back 18 A |
front 19  60) Which of the following graphs illustrates the growth over several seasons of a population of snowshoe hares that were introduced to an appropriate habitat also inhabited by predators in northern Canada? A. SEE IMAGE | back 19 D |
front 20 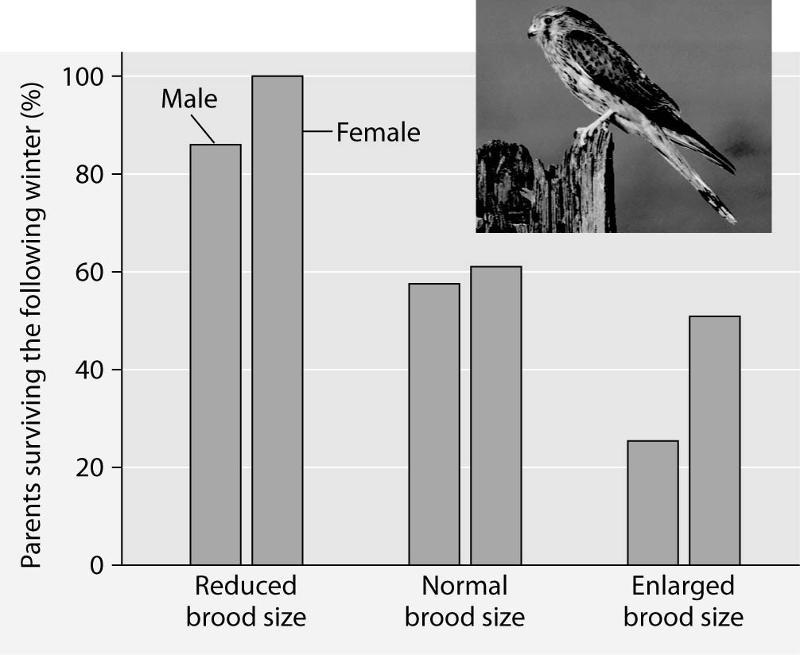 Please read the paragraph below and review Figure 53.2 to answer the
following question. | back 20 There appears to be a negative correlation between brood enlargements and parental survival. |
front 21 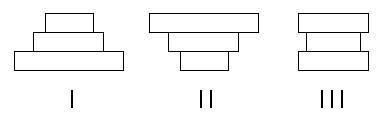 The following questions refer to Figure 53.3, which depicts the age
structure of three populations. | back 21 II |
front 22  The following questions refer to Figure 53.3, which depicts the age
structure of three populations. | back 22 III |
front 23  The following questions refer to Figure 53.3, which depicts the age
structure of three populations. | back 23 I |
front 24  The following questions refer to Figure 53.3, which depicts the age
structure of three populations. | back 24 III |
front 25  Refer to Figure 53.4 and then answer the following questions. | back 25 Developed countries have lower infant mortality rates and higher life expectancy than developing countries. |
front 26 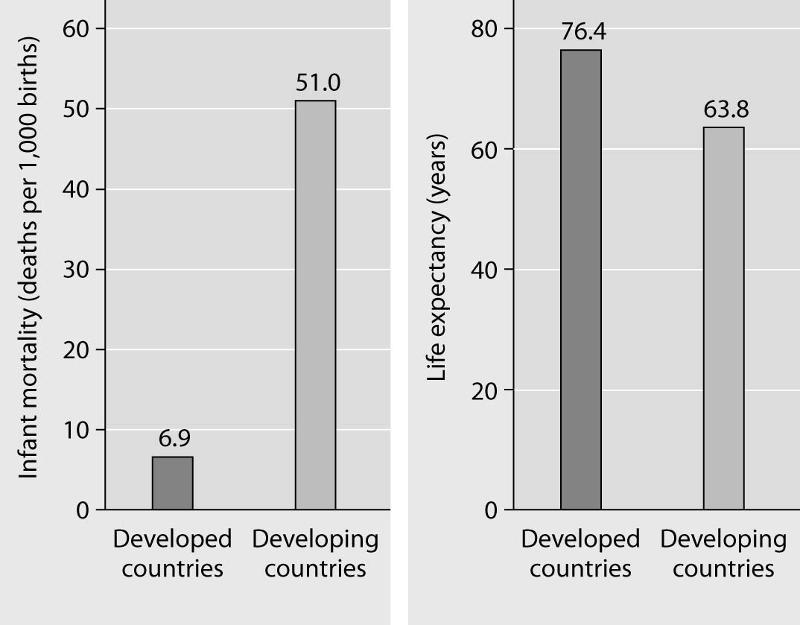 Refer to Figure 53.4 and then answer the following questions. | back 26 Afghanistan, with a 3.85 annual growth rate |
front 27 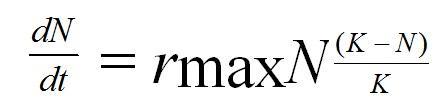 76) According to the logistic growth equation | back 27 population growth is zero when N equals K. |
front 28  The eight climographs below show yearly temperature (line graph and
left vertical axis) and precipitation (bar graph and right vertical
axis) averages for each month for some locations on Earth. Choose the
climograph that best answers the question or completes the statement.
Climographs may be used once, more than once, or not at all. | back 28 A |
front 29  The eight climographs below show yearly temperature (line graph and
left vertical axis) and precipitation (bar graph and right vertical
axis) averages for each month for some locations on Earth. Choose the
climograph that best answers the question or completes the statement.
Climographs may be used once, more than once, or not at all. | back 29 F |
front 30  The eight climographs below show yearly temperature (line graph and
left vertical axis) and precipitation (bar graph and right vertical
axis) averages for each month for some locations on Earth. Choose the
climograph that best answers the question or completes the statement.
Climographs may be used once, more than once, or not at all. | back 30 D |
front 31  The eight climographs below show yearly temperature (line graph and
left vertical axis) and precipitation (bar graph and right vertical
axis) averages for each month for some locations on Earth. Choose the
climograph that best answers the question or completes the statement.
Climographs may be used once, more than once, or not at all. | back 31 E |
front 32 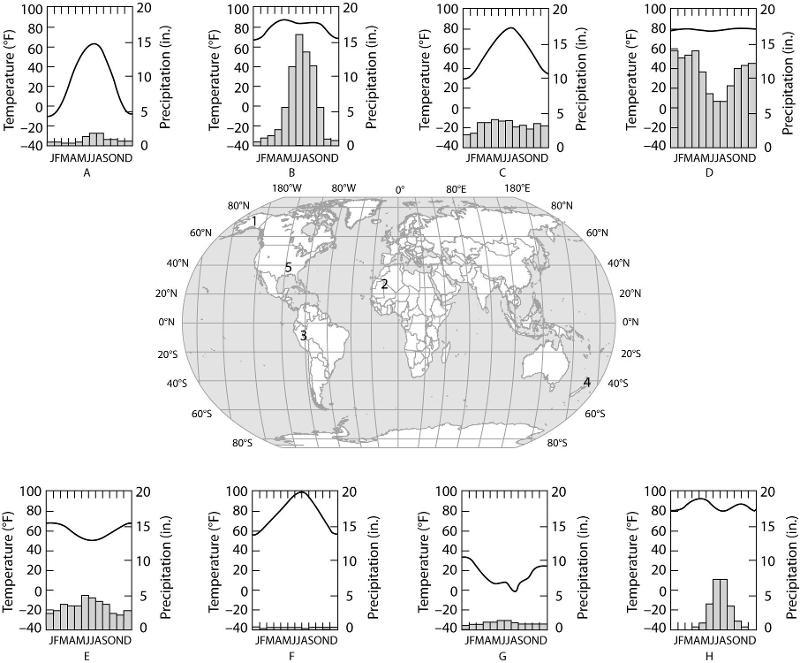 The eight climographs below show yearly temperature (line graph and
left vertical axis) and precipitation (bar graph and right vertical
axis) averages for each month for some locations on Earth. Choose the
climograph that best answers the question or completes the statement.
Climographs may be used once, more than once, or not at all. | back 32 C |
front 33  The eight climographs below show yearly temperature (line graph and
left vertical axis) and precipitation (bar graph and right vertical
axis) averages for each month for some locations on Earth. Choose the
climograph that best answers the question or completes the statement.
Climographs may be used once, more than once, or not at all. | back 33 The temperature is high for each monthly average. |
front 34  The diagram shows a generalized cross section of the marine
environment with various zones labeled with letters. Choose the letter
that best answers the question. Letters may be used once, more than
once, or not at all | back 34 C |
front 35  The diagram shows a generalized cross section of the marine
environment with various zones labeled with letters. Choose the letter
that best answers the question. Letters may be used once, more than
once, or not at all | back 35 B |
front 36  The diagram shows a generalized cross section of the marine
environment with various zones labeled with letters. Choose the letter
that best answers the question. Letters may be used once, more than
once, or not at all | back 36 C |
front 37 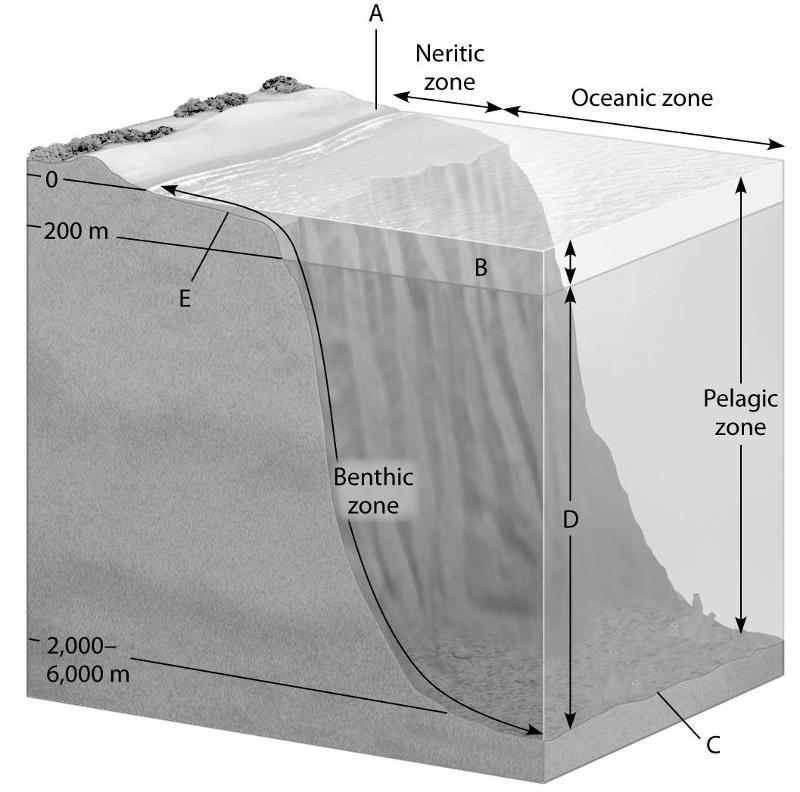 The diagram shows a generalized cross section of the marine
environment with various zones labeled with letters. Choose the letter
that best answers the question. Letters may be used once, more than
once, or not at all | back 37 D |
front 38  The diagram shows a generalized cross section of the marine
environment with various zones labeled with letters. Choose the letter
that best answers the question. Letters may be used once, more than
once, or not at all | back 38 A |
front 39 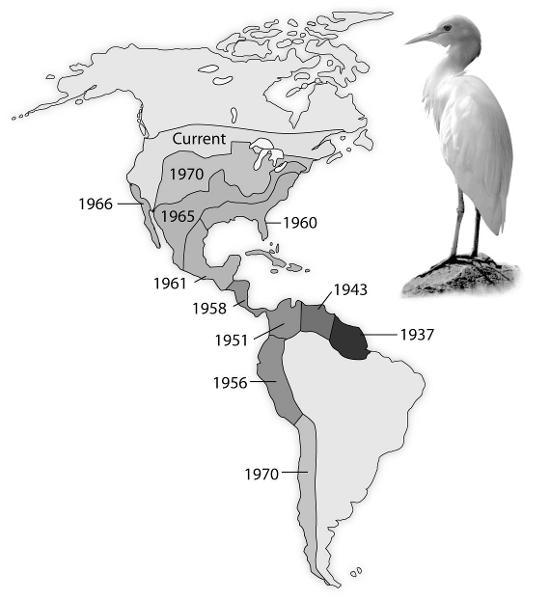 Use the following diagram from the text showing the spread of the
cattle egret, Bubulcus ibis, since its arrival in the New World, to
answer the following question. | back 39 A habitat left unoccupied by native herons and egrets met the biotic and abiotic requirements of the cattle egret transplants and their descendants. |
front 40 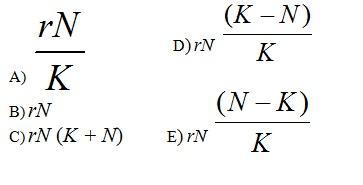 19) Exponential growth of a population is represented by dN/dt = | back 40 rN |
front 41 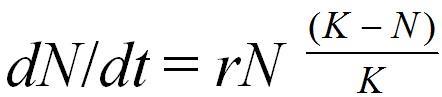 76) According to the logistic growth equation | back 41 population growth is zero when N equals K |
front 42  49) Which of the following statements is a valid conclusion of this
experiment? | back 42 When Balanus is removed, it can be observed that the realized niche of Chthamalus is smaller than its fundamental niche |
front 43  50) Connell conducted this experiment to learn more about | back 43 competitive exclusion and distribution of barnacle species. |
front 44 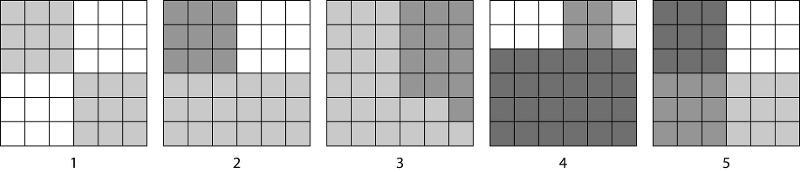 51) According to the Shannon Diversity Index, which block would show
the greatest diversity? | back 44 5 |
front 45 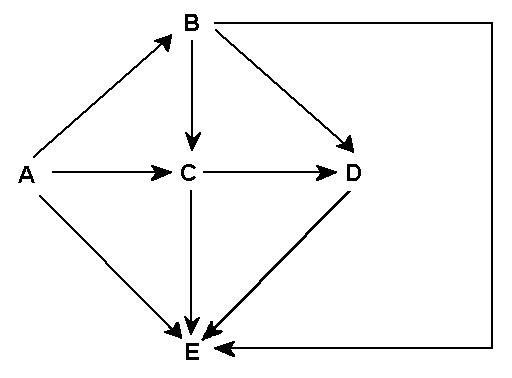 Food web for a particular terrestrial ecosystem (arrows represent
energy flow and letters represent species) | back 45 A |
front 46  Food web for a particular terrestrial ecosystem (arrows represent
energy flow and letters represent species) | back 46 E |
front 47  Food web for a particular terrestrial ecosystem (arrows represent
energy flow and letters represent species) | back 47 B |
front 48  Food web for a particular terrestrial ecosystem (arrows represent
energy flow and letters represent species) | back 48 C and E |
front 49  Diagram of a food web (arrows represent energy flow and letters
represent species) | back 49 less than the biomass of A + B. |
front 50 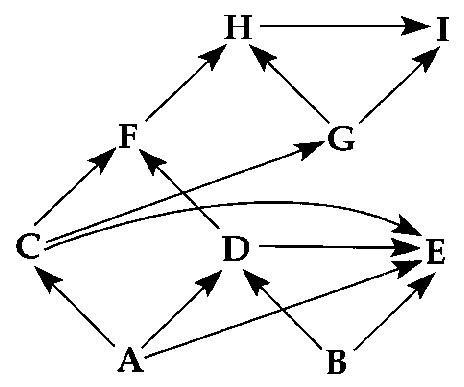 Diagram of a food web (arrows represent energy flow and letters
represent species) | back 50 A |
front 51  67) On the diagram of the nitrogen cycle, which number represents
nitrite (NO₂)? | back 51 3 |
front 52 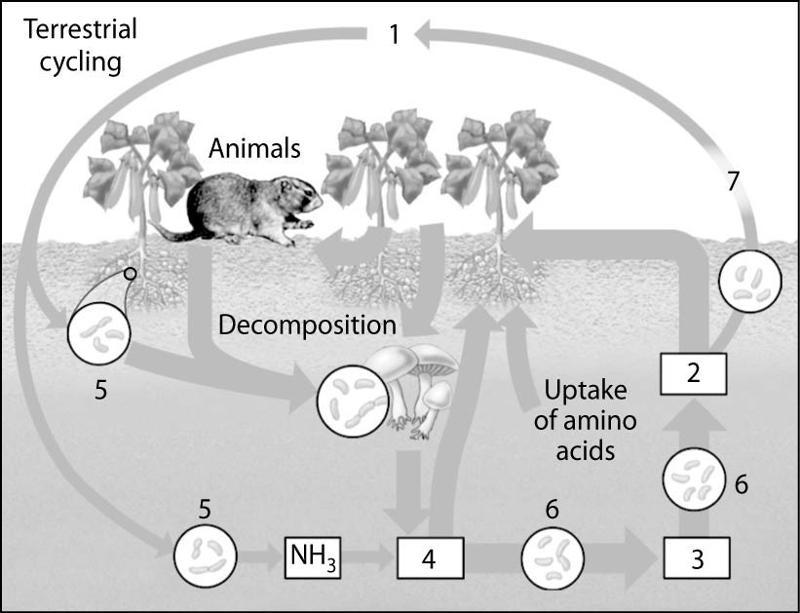 68) On the diagram of the nitrogen cycle, which number represents
ammonia (NH₄+)? | back 52 4 |
front 53  69) On the diagram of the nitrogen cycle, which number represents
nitrogen-fixing bacteria? | back 53 5 |
front 54  70) On the diagram of the nitrogen cycle, which number represents
nitrifying bacteria? | back 54 6 |