AS Statistics 1
Types of graphs and date
categorical, ranked, discrete numerical (countable), continuous numerical (range).
Box plot shows minimum, the quartiles, median and maximum.
Frequency polygon is a regular line graph. Cumulative frequency curve.
Histogram is bar chart for continuous data.
How to calculate a specific percentile
Percentile wanted x total frequency / 100
averages are referred to measures of central tendency.
Standard deviation and outliers
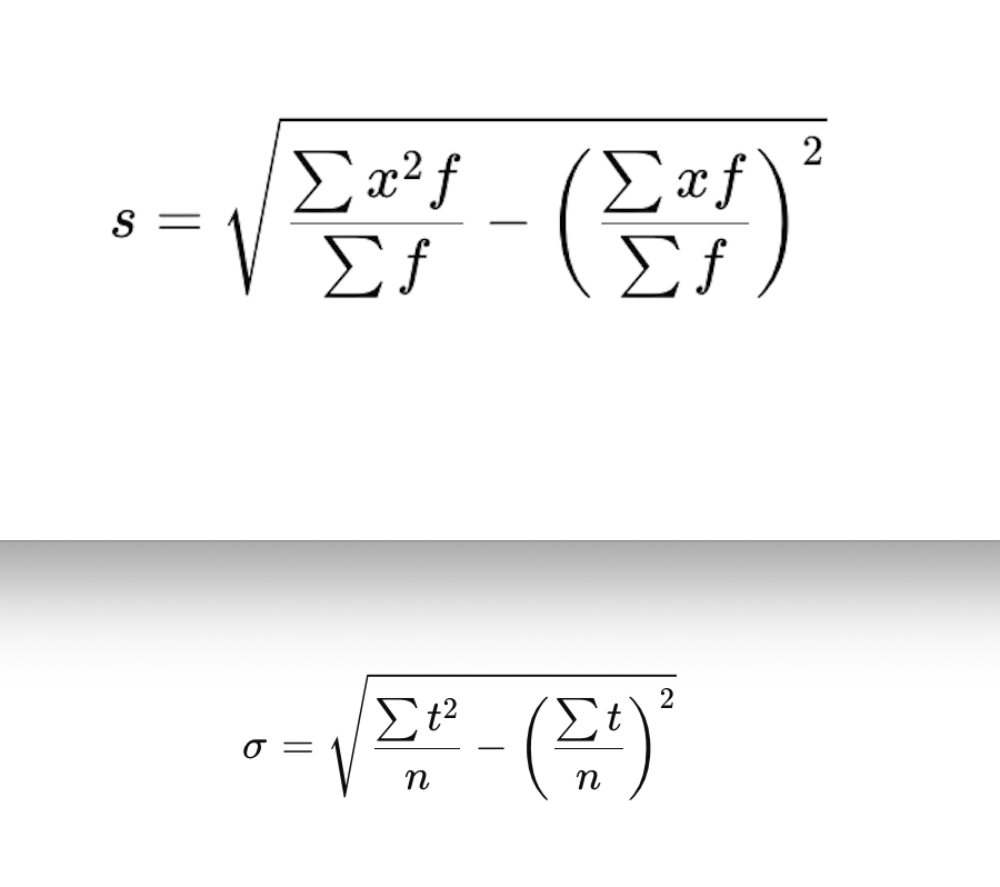
Standard deviation - deviation is value - mean. Square the deviations and then find the means of them for the range of values. Then square root.
Outliers are 1.5 x the interquartile range. either lower the lower quartile or over upper quartile. or 2 standard deviations away from the mean.
working with histograms
Frequency = frequency density × class width
Mean = frequency x midpoint / frequency