Use the graph to answer the following question.
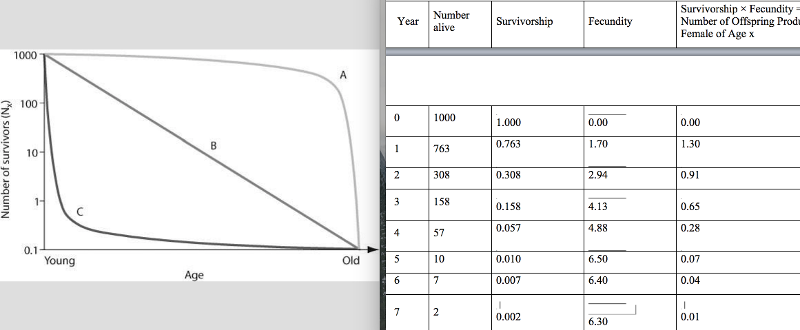
In the figure, which of the following survivorship curves implies that an animal may lay many eggs, of which a regular number die each year on a logarithmic scale?
A) curve A
B) curve B
C) curve C
D) curves A or C
Answer: B
Use the graph to answer the following question.
In the figure, which of the following survivorship curves most applies to humans living in developed countries?
A) curve A
B) curve B
C) curve C
D) curve A or curve B
Answer: A
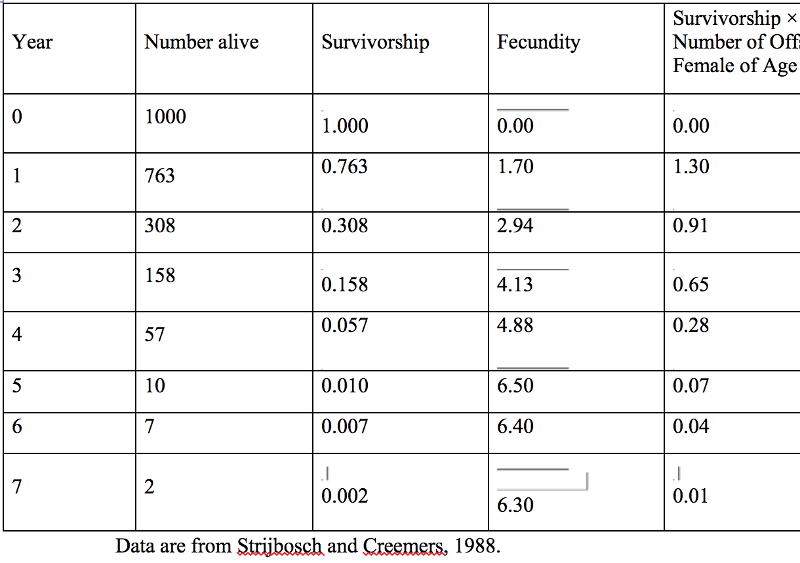
Use the figure to answer the following question.
Life Table for Zootoca vivipara in the Netherlands
Data are from Strijbosch and Creemers, 1988.
Using the table, how would you describe the population dynamics of the Eurasian lizard, Z. vivipara?
A) The population is increasing.
B) The population is decreasing.
C) The population is stable.
D) The table does not provide this information.
Answer: A

Using the table, determine which age class year would cause the largest decline in the resulting population growth, if it were wiped out by disease.
A) age class year 1
B) age class year 2
C) age class year 3
D) age class year 4
Answer: A
Suppose researchers marked 800 turtles and later were able to trap a total of 300 individuals in that population, of which 150 were marked. What is the estimate for total population size?
A) 200
B) 1,050
C) 1,600
D) 2,100
Answer: C
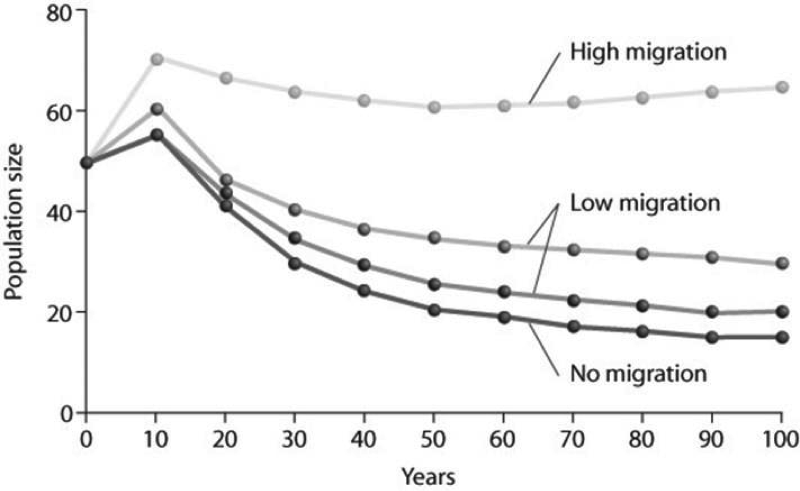
Use the graph to answer the following question.
Looking at the figure, what factor is contributing significantly to stabilizing the population size over time?
I) no migration
II) low migration
III) high migration
A) only I
B) only II
C) only III
D) only II and III
Answer: C
Which of the following assumptions must be made regarding the mark-recapture estimate of population size?
I) Marked and unmarked individuals have the same probability of being trapped.
II) The marked individuals have thoroughly mixed with the population after being marked.
III) No individuals have entered or left the population by immigration or emigration, and no individuals have been added by birth or eliminated by death during the course of the estimate.
A) I only
B) II only
C) I and II only
D) I, II, and III
Answer: D

Which of the following is the most important assumption for the mark-recapture method to estimate the size of wildlife populations?
A) More individuals emigrate from, as opposed to immigrate into, a population.
B) Over 50% of the marked individuals were trapped during the recapture phase.
C) There is a 50:50 ratio of males to females in the population before and after trapping and recapture.
D) Marked individuals have the same probability of being recaptured as unmarked individuals during the recapture phase.
Answer: D
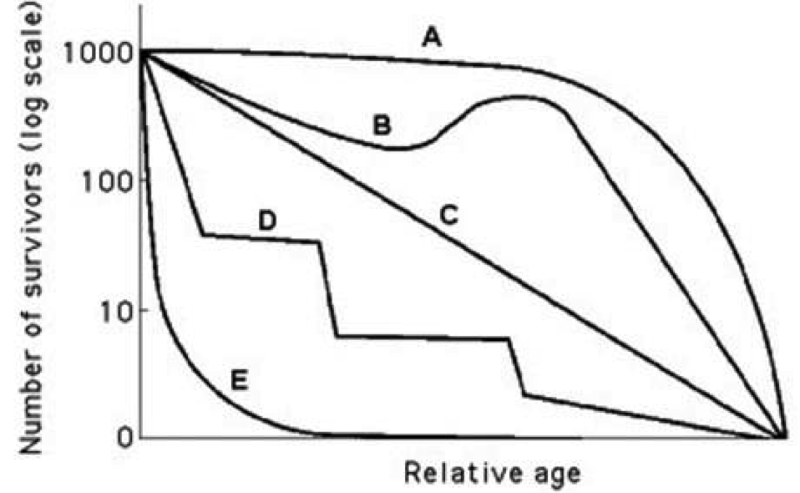
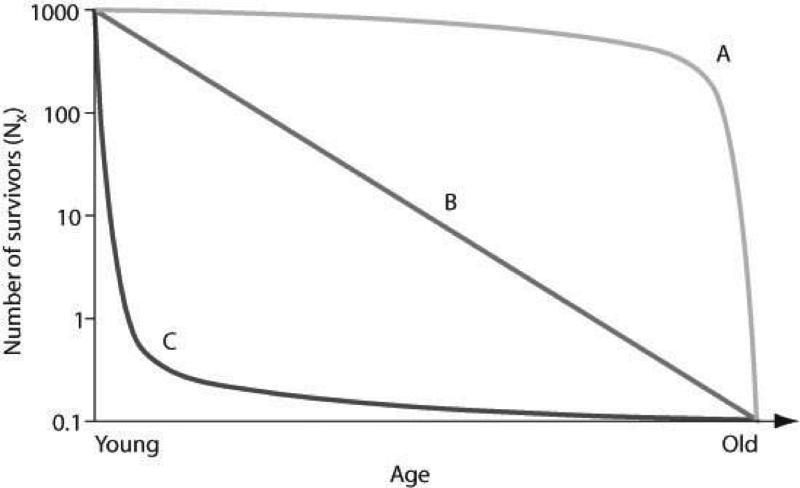
Use the survivorship curves in the figure to answer the following question.
Which curve best describes survivorship in marine mollusks?
A) A
B) B
C) C
D) E
Answer: D

Use the survivorship curves in the figure to answer the following question.
Which curve best describes survivorship in elephants?
A) A
B) B
C) C
D) E
Answer: A
To measure the population of lake trout in a 250-hectare lake, 400 individual trout were netted and marked with a fin clip, then returned to the lake. The next week, the lake was netted again, and out of the 200 lake trout that were caught, 50 had fin clips. Using the mark-recapture estimate, the lake trout population size could be closest to which of the following?
A) 200
B) 400
C) 1,600
D) 80,000
Answer: C
Long-term studies of Belding's ground squirrels show that immigrants move nearly 2 kilometers from where they are born and become 1%-8% of the males and 0.7%-6% of the females in other populations. On an evolutionary scale, why is this significant?
A) These immigrants make up for the deaths of individuals, keeping the other populations' size stable.
B) These immigrants provide a source of genetic diversity for the other populations.
C) Those individuals that emigrate to these new populations are looking for less crowded conditions with more resources.
D) Gradually, the populations of ground squirrels will move from a clumped to a uniform population pattern of dispersion.
Answer: B
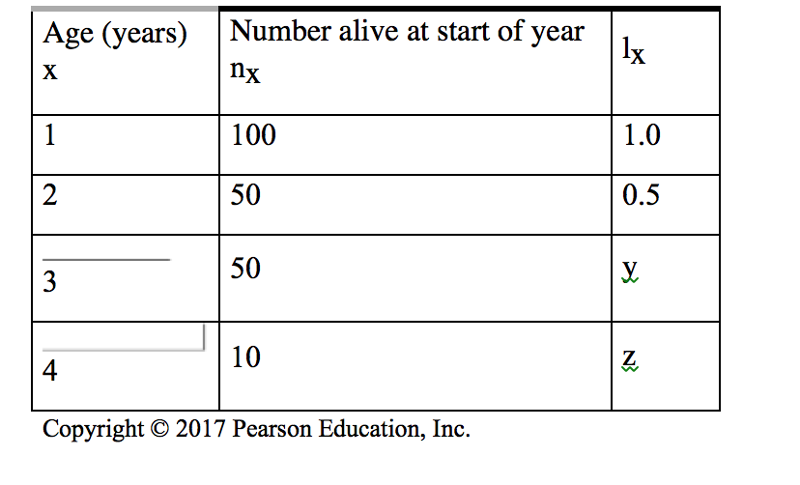
Use the table to answer the following question.
In the accompanying life table of a hypothetical population, what are the missing values for lx (y
and z)? lx = the proportion alive at the start of year (age specific survivorship rate).
A) y = 0.5, z = 0.5
B) y = 1.0, z = 0.5
C) y = 0.5, z = 0.1
D) y = 1.0, z = 0.2
Answer: C
An ecologist recorded 12 white-tailed deer, Odocoileus virginianus, per square kilometer
(km2) in one woodlot and 20 km2 in another woodlot. What was the ecologist comparing?
A) density
B) dispersion
C) carrying capacity
D) range
Answer: A
Uniform spacing patterns in plants such as the creosote bush are most often associated with ________.
A) patterns of high humidity
B) the random distribution of seeds
C) competitive interaction between individuals of the same population
D) the concentration of nutrients within the population's range
Answer: C
Which of the following groups would be most likely to exhibit uniform dispersion?
A) red squirrels, who actively defend territories
B) cattails, which grow primarily at edges of lakes and streams
C) dwarf mistletoes, which parasitize particular species of forest tree
D) lake trout, which seek out cold, deep water high in dissolved oxygen
Answer: A
Which of the following examples would most accurately measure the dispersion of a population being studied?
A) counting the number of times a one-kilometer transect is intersected by tracks of red squirrels after a snowfall
B) measuring the distance between several burrows within a large prairie dog colony in a grassland
C) measuring the average distance between individuals and their nearest neighbor, and then analyzing the variation and comparing those measurements at larger scales
D) counting the number of zebras from airplane census observations
Answer: C
Which of the following scenarios would provide the most accurate data on population density?
A) Count the number of nests of a particular species of songbird and multiply this by a factor that extrapolates these data to actual animals.
B) Count the number of pine trees in several randomly selected 10-meter-square plots and extrapolate this number to the fraction of the study area these plots represent.
C) Use the mark-recapture method to estimate the size of the population.
D) Calculate the difference between all of the immigrants and emigrants to see if the population is growing or shrinking.
Answer: B
Which of the following is the best natural example of a uniform pattern of dispersion?
A) bees collecting pollen in a wildflower meadow
B) moss spores floating in the wind to new locations of a forest
C) territorial songbirds in a mature forest during mating season
D) mushrooms growing on the floor of an old growth forest
Answer: D

Use the survivorship curves in the figure to answer the following question.
Which statement best explains survivorship curve B?
A) It is likely a species that provides little postnatal care, but lots of care for offspring during midlife as indicated by increased survivorship.
B) This curve is likely for a species that produces lots of offspring, only a few of which are expected to survive
. C) It is likely a species where no individuals in the cohort die when they are at 60-70% relative age.
D) Survivorship can only decrease; therefore, this curve could not happen in nature.
Answer: D

Use the graph to answer the following question.
Which of the following examples are plausible explanations for a population that would produce curve A in the figure?
I. Ongoing predation of rabbits throughout their lives
II. Susceptibility of older humans to heart disease
III. High seedling mortality in sunflowers
A) I only
B) II only
C) I and II
D) II and III
Answer: B
) In July 2008, the United States had a population of approximately 302,000,000 people. How many Americans were there in July 2009, if the estimated 2008 growth rate was 0.88%?
A) 567,760,000
B) 304,657,600
C) 304,000,000
D) 2,657,600
Answer: B
In 2008, the population of New Zealand was approximately 4,275,000 people. If the birth rate was 14 births for every 1,000 people, approximately how many births occurred in New Zealand in 2008?
A) 6,000
B) 42,275
C) 59,850
D) 140,000
Answer: C
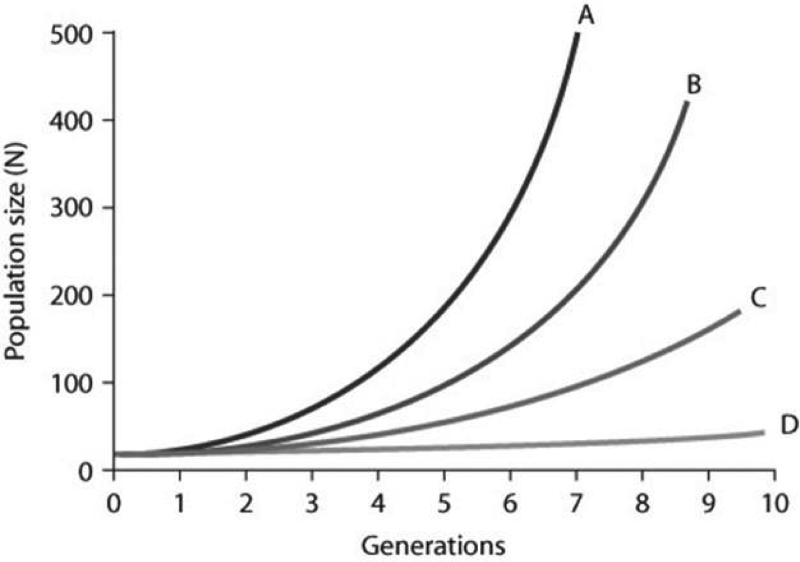
Use the graph to answer the following question.
In the figure, curves A-D depict per capita rate increases (r). Which of the following best explains the difference between the shapes of these curves?
A) The population growth is logistic as generations continue to form
. B) The growth is exponential for curves A and B, but because population growth for C and D is slower, it is considered logistic.
C) Population growth within each curve gets steeper as time passes because growth depends on both per capita rates of increase and current population size.
D) Curve A has the fastest rate of logistic growth.
Answer: C
A population of ground squirrels has an annual per capita birth rate of 0.06 and an annual per capita death rate of 0.02. Using these birth and death rates, calculate an estimate of the total number of individuals added to (or lost from) a population of 1,000 individuals in one year.
A) 120 individuals added
B) 40 individuals added
C) 20 individuals added
D) 400 individuals added
Answer: B
Starting from a single individual, what is the size of a population of bacteria at the end of a 2-hour time period if they reproduce by binary fission every 20 minutes? (Assume unlimited resources and no mortality.)
A) 16
B) 32
C) 64
D) 128
Answer: C
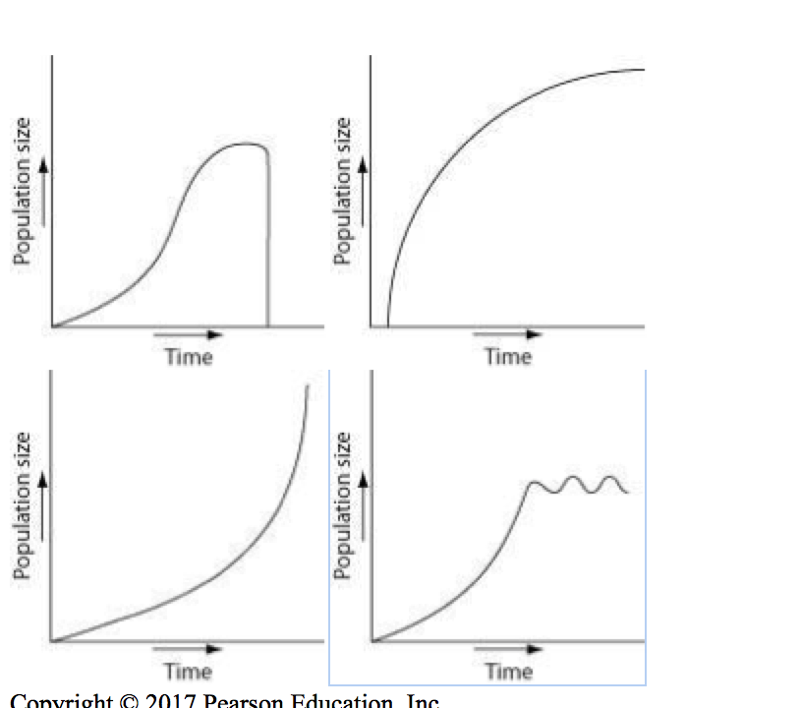
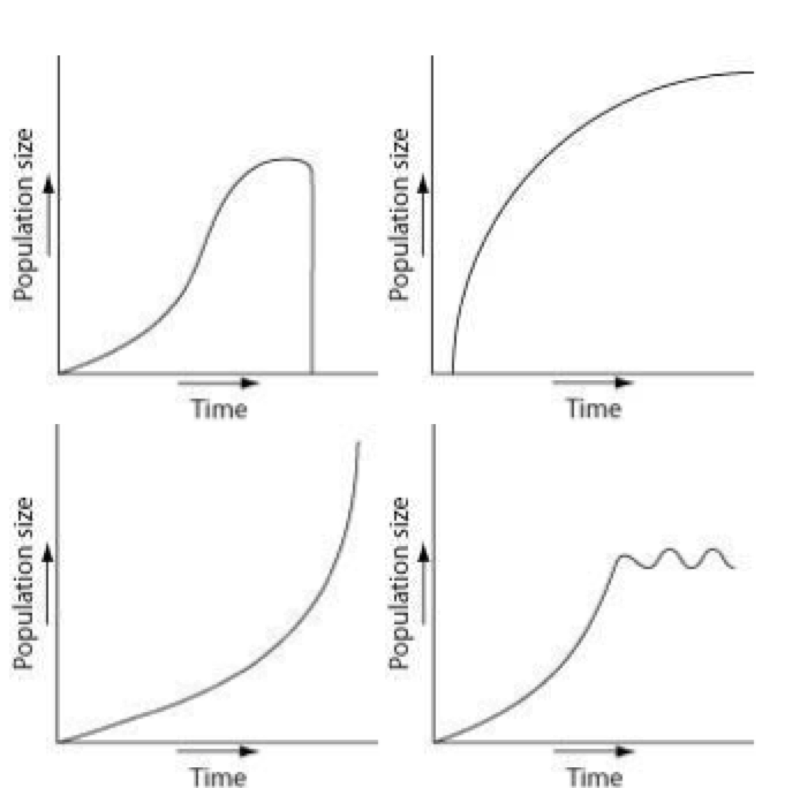
Which of the following graphs illustrates the population growth curve starting with a single bacterium growing in a flask of ideal medium at optimum temperature over a two-hour period? Assume resources do not become limiting over this time frame.
A)
B)
C)
D)
Answer: C
During exponential growth, a population always ________.
A) grows at its maximum per capita rate
B) quickly reaches its carrying capacity
C) adds more new individuals when the population is small than when it is large
D) loses some individuals to emigration
Answer: A
Consider two old-growth forests: One is undisturbed while the other is being logged. In which region are species likely to experience exponential growth, and why?
A) old growth, because of stable conditions that would favor exponential growth of all species in the forest
B) old growth, because each of the species is well established and can produce many offspring
C) logged, because the disturbed forest affords more resources for increased specific populations to grow
D) logged, because the various populations are stimulated to a higher reproductive potential
Answer: C
Imagine that you are managing a large game ranch. You know from historical accounts that a species of deer used to live there, but they have been extirpated. After doing some research to determine what might be an appropriately sized founding population, you reintroduce them. You then watch the population increase for several generations, and graph the number of individuals (vertical axis) against the number of generations (horizontal axis). With no natural predators impacting the population, the graph will likely appear as ________.
A) a diagonal line, getting higher with each generation
B) an "S" that ends with a vertical line
C) an upside-down "U"
D) a "J," increasing with each generation
Answer: D
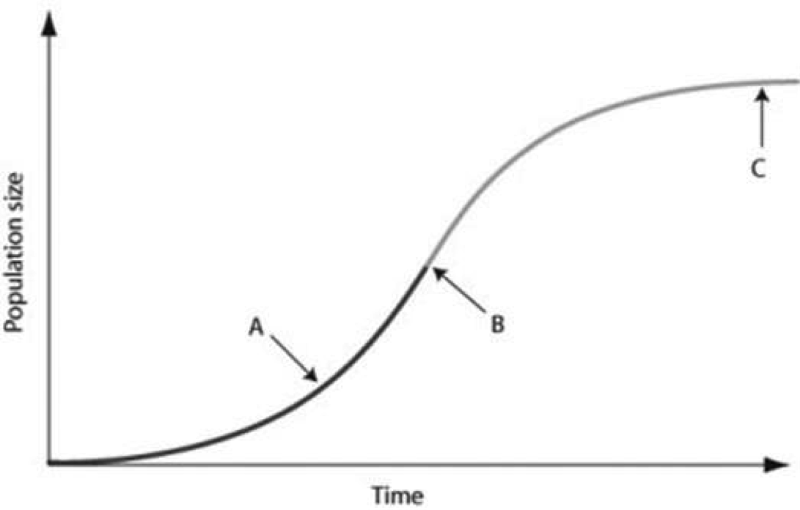
Use the graph to answer the following question.
In the figure, which of the arrows represents the carrying capacity?
A) arrow A
B) arrow B
C) arrow C
D) Carrying capacity cannot be found in the figure because species under density-dependent control never reach carrying capacity.
Answer: C
Which statements about K are correct?
I) K varies among populations.
II) K varies in space.
III) K varies in time.
IV) K is constant for any given species.
A) only I and III
B) only II and IV
C) only I, II, and III
D) only II, III, and IV
Answer: C
As N approaches K for a certain population, which of the following outcomes is predicted by the logistic equation?
A) The population growth rate will not change.
B) The population growth rate will approach zero.
C) The population size will increase exponentially.
D) The carrying capacity of the environment will increase.
Answer: B
Which of the following causes populations to shift most quickly from an exponential to a logistic population growth?
A) favorable climatic conditions
B) removal of predators
C) decreased death rate
D) competition for resources
Answer: D
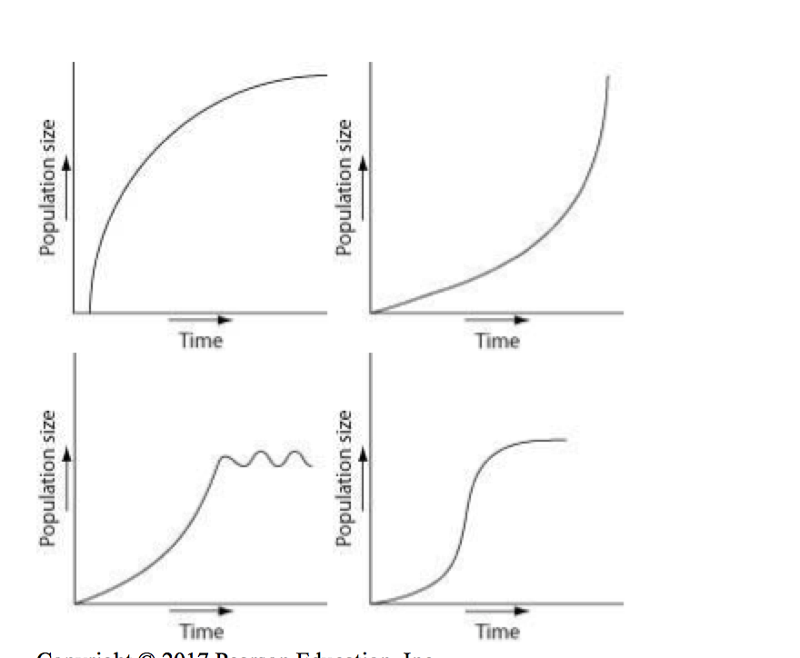
Which of the following graphs best illustrates the growth curve of a small population of rodents that has increased to a static carrying capacity?
A)
B)
C)
D)
Answer: D
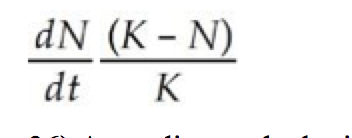
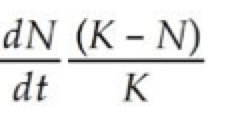
According to the logistic growth equation, = rN , ________.
A) the number of individuals added per unit time is greatest when N is close to zero
B) the per capita growth rate (r) increases as N approaches K
C) population growth is zero when N equals K
D) the population grows exponentially when K is small
Answer: C
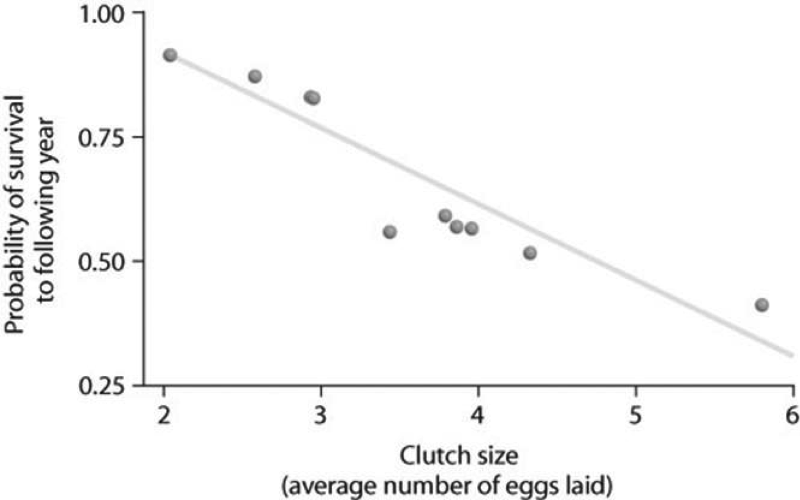
Use the graph to answer the following question.
Looking at the data in the figure, what can be said about survival and clutch size?
A) Animals with low survival tend to have smaller clutch sizes.
B) Large clutch size correlates with low survival.
C) Animals with high survival tend to have medium-sized clutches.
D) Probability of survivorship does not correlate with clutch size.
Answer: B

What is the primary limiting factor that determines why no female animal can produce a very large number of very large eggs?
A) Time is limited.
B) There are energy constraints.
C) Temperature constraints will prevent females from carrying too many eggs.
D) There will be an increase in predation pressure if the females carry too many large eggs.
Answer: B
You observe two breeding female fish of the same species. One female lays 100 eggs and the other female lays 1,000 eggs. Which one of the following outcomes is most likely, given the limits of fitness trade-offs?
A) The female laying 1,000 eggs breeds more often than the female laying 100 eggs.
B) The female laying 100 eggs lives longer than the female laying 1,000 eggs.
C) The eggs from the female laying 1,000 eggs have larger yolks than the yolks of the eggs from the female laying 100 eggs.
D) The female laying 100 eggs is larger than the female laying 1,000 eggs.
Answer: B
Use the graph to answer the following question.
Based on the figure, which of the following statements correctly interprets the data?
A) Clutch size is always lowest at a density of about 35 females.
B) As female density increases, survivorship decreases.
C) Clutch size increases as female density increases.
D) Clutch size is inversely related to density.
Answer: D
Which pair of terms most accurately describes life history traits for a stable population of wolves?
A) semelparous; r-selected
B) semelparous; K-selected
C) iteroparous; r-selected
D) iteroparous; K-selected
Answer: D
Natural selection involves energetic trade-offs between ________.
A) choosing how many offspring to produce over the course of a lifetime and how long to live
B) producing large numbers of gametes when employing internal fertilization versus fewer numbers of gametes when employing external fertilization
C) increasing the number of individuals produced during each reproductive episode and a corresponding decrease in parental care
D) high survival rates of offspring and the cost of parental care
Answer: D
Which of the following traits is characteristic of K-selected populations?
A) offspring with good chances of survival
B) many offspring per reproductive episode
C) small offspring
D) a high intrinsic rate of increase
Answer: A
In which of the following situations would you expect to find the largest number of r- selected individuals?
A) a recently abandoned agricultural field in Colorado
B) a sand dune community south of Lake Michigan
C) an old-growth forest with large, mature trees
D) a coral reef community off the coast of Mexico
Answer: A
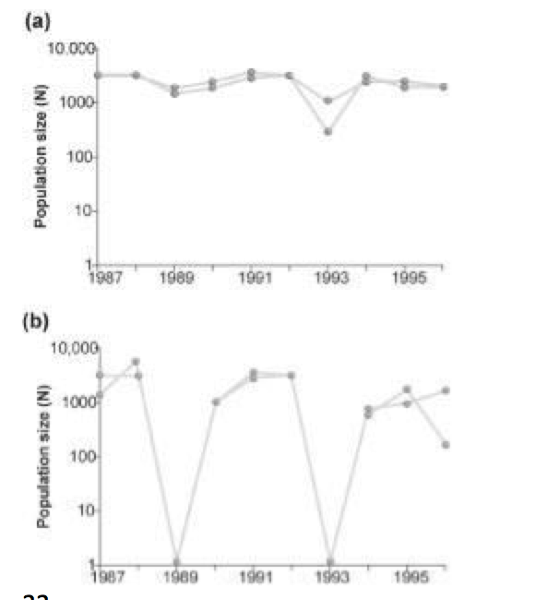
Use the graphs to answer the following question.
Graph (b) in the figure shows the normal fluctuations of a population of grouse, a ground-nesting bird. Assuming graph (a) in the figure is the result of some experimental treatment in the grouse population, what can be concluded?
A) The experimental treatment intensified the population cycling.
B) The experimental treatment did not affect population cycling in this species.
C) The experimental treatment has most likely identified the cause of population cycling.
D) The experimental treatment involved the introduction of a predator of the bird.
Answer: C
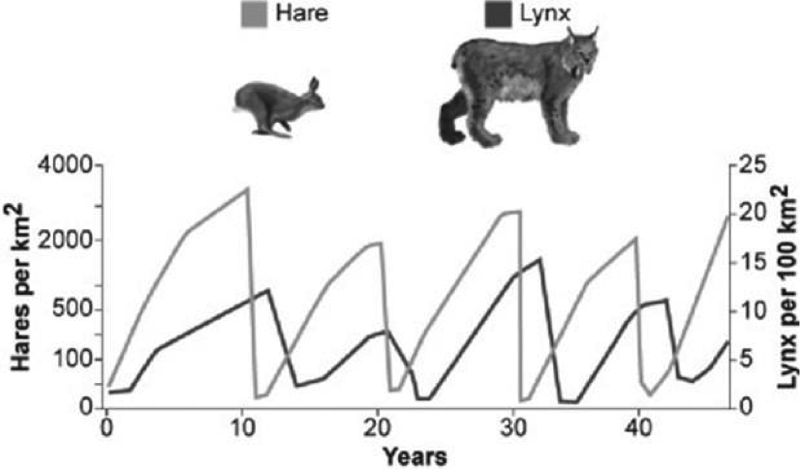
Use the graph to answer the following question.
What conclusion can you draw from the figure?
A) Hares decrease in number just before lynx population size increases.
B) Lynx control hare population size.
C) Lynx and hare populations are independent of each other.
D) The relationship between the populations cannot be determined only from this graph.
Answer: D
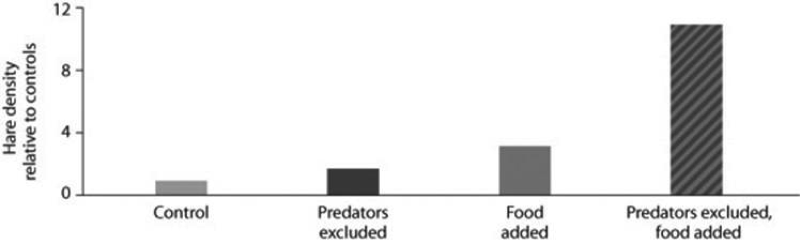
Use the figure to answer the following question
Looking at the data in the figure from the hare/lynx experiment, what conclusion(s) can you draw?
I) Food is a factor in controlling hare population size.
II) Excluding lynx is a factor in controlling hare population size.
III) The effect of excluding predators and adding food in the same experiment is greater than the sum of excluding lynx alone plus adding food alone.
A) only I
B) only II
C) only III
D) I, II, and III
Answer: D
Often the growth cycle of one population has an effect on the cycle of another. As moose populations increase, for example, wolf populations also increase. Thus, if we are considering the logistic equation for the wolf population,
= rN ,
which of the factors accounts for the effect of the moose population?
A) r
B) N
C) rN
D) K
Answer: D
Which of the following graphs illustrates the growth over several seasons of a population of snowshoe hares that were introduced to an appropriate habitat also inhabited by predators in northern Canada?
A)
B)
C)
D)
Answer: D
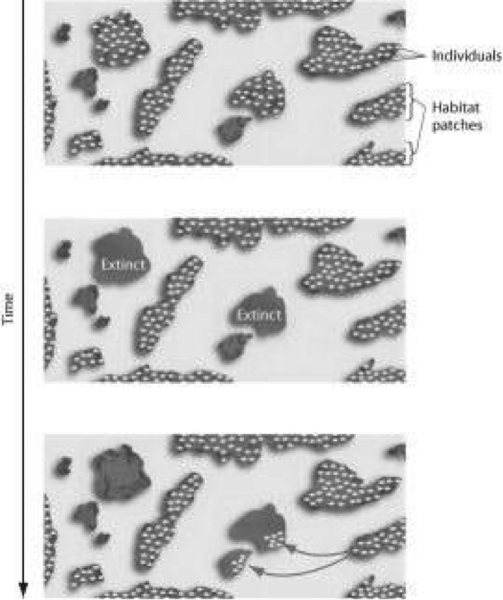
Use the figure to answer the following question.
The figure represents the dynamics of ________. A) metapopulations
B) extinction
C) emigration
D) both extinction and emigration
Answer: A
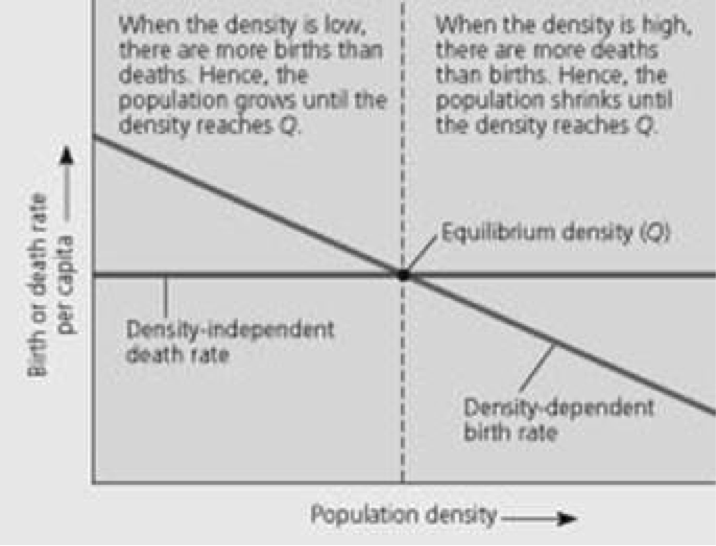
Use the figure to answer the following question.
In the figure, imagine a different scenario where the death rate per capita was dependent upon (and positively correlated with) the density of the population, and the birth rate was instead density independent. As the density of the population increased, ________.
A) the death rate would decrease and the birth rate would decrease
B) the death rate would increase and the birth rate would decrease
C) the death rate would increase and the birth rate would remain stable
D) the death rate would remain stable and the birth rate would increase
Answer: C
A population of white-footed mice becomes severely overpopulated in a habitat that has been disturbed by human activity. Sometimes intrinsic factors cause the population to increase in mortality and cause lower reproduction rates to occur in reaction to the stress of overpopulation. Which of the following is an example of intrinsic population control?
A) Owl populations frequent the area more often because of increased hunting success.
B) Females undergo hormonal changes that delay sexual maturation, and many individuals suffer depressed immune systems and die due to the stress of overpopulation.
C) Clumped dispersion of the population leads to increased spread of disease and parasites, resulting in a population crash.
D) All of the resources (food and shelter) are used up by overpopulation, and much of the population dies of exposure and/or starvation.
Answer: B
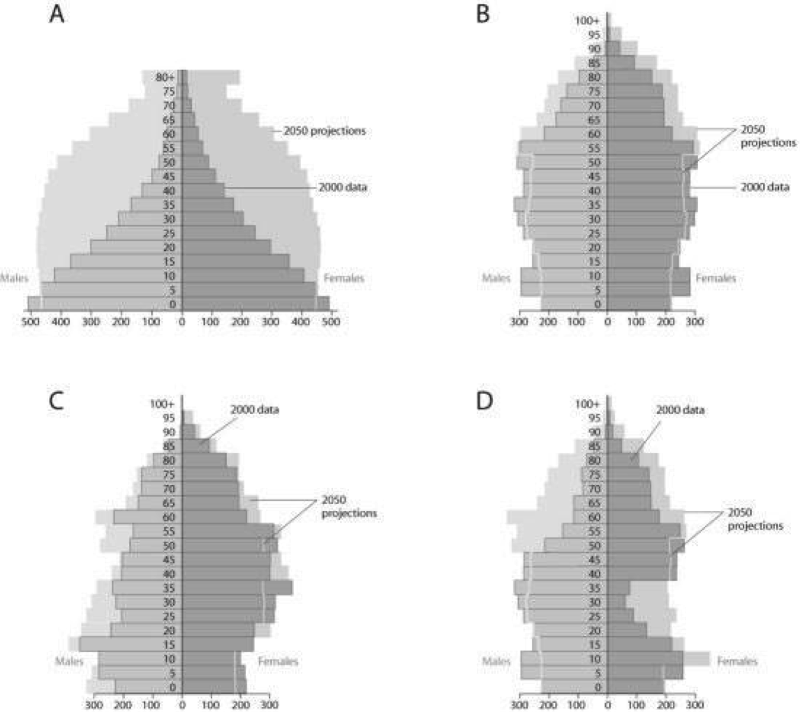
Use the figures to answer the following question.
Based on the diagrams in the figure and on the large population of baby boomers in the United States, which graph best reflects U.S. population in 20 years?
A) A
B) B
C) C
D) D
Answer: B
Which of the following statements regarding the future of populations in developing, less industrialized countries are correct?
I) The reproductive rates are predicted to remain below replacement level.
II) Survivorship will increase.
III) Overall population size will increase dramatically.
IV) The fertility rate is predicted to remain high, especially in some regions.
A) only I and III
B) only II and IV
C) only II, III, and IV
D) only I, II, and III
Answer: C
Why does the U.S. population continue to grow even though the United States has essentially established a zero population growth (ZPG)?
A) emigration
B) immigration
C) baby boomer reproduction
D) the 2007-2009 economic recession
Answer: B
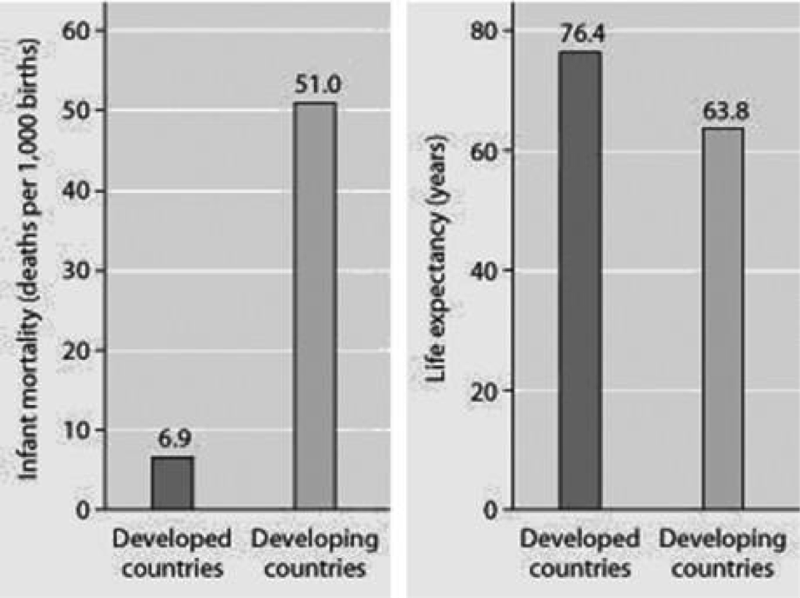
Use the figure to answer the following question.
Infant mortality and life expectancy at birth in developed and developing countries (data as of 2005).
What is a logical conclusion that can be drawn from the graphs? Developed countries have ________.
A) lower infant mortality rates and lower life expectancy than developing countries
B) higher infant mortality rates and lower life expectancy than developing countries
C) lower infant mortality rates and higher life expectancy than developing countries
D) higher infant mortality rates and higher life expectancy than developing countries
Answer: C
A recent study of ecological footprints concluded that ________.
A) Earth's carrying capacity would increase if per capita meat consumption increased
B) current demand by industrialized countries for resources is much smaller than the ecological footprint of those countries
C) it is not possible for technological improvements to increase Earth's carrying capacity for humans
D) the ecological footprint of the United States is large because per capita resource use is high
Answer: D
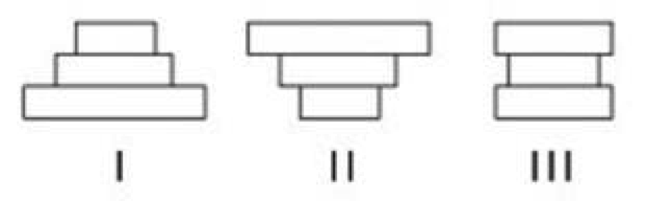
The following question refers to the figure below, which depicts the age structure populations.
In the figure, populations of a plant species labeled I, II, and III are depicted using simplified age structures containing three age classes: young seedlings, middle-aged juveniles, and older adults. Which population(s) appear(s) to have stable growth? A) I
B) III
C) I and II
D) II and III
Answer: B
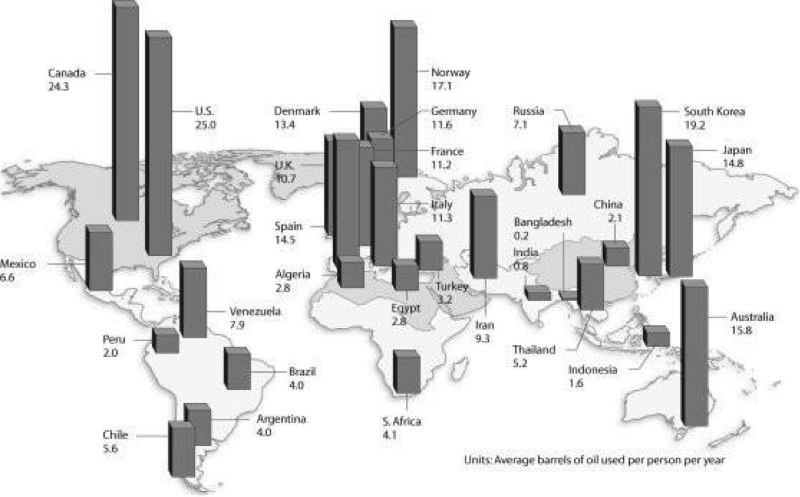
Use the figure to answer the following question.
Based on the figure and given the populations of the following countries, which country uses the most oil overall?
A) United States (population = 320 million)
B) Canada (population = 36 million)
C) China (population = 1.33 billion)
D) Russia (population = 144 million)
Answer: A
Population ecologists follow the fate of same-age cohorts to
A) determine a population's carrying capacity.
B) determine the birth rate and death rate of each group in a population.
C) determine if a population is regulated by density-dependent processes.
D) determine the factors that affect the size of a population. Answer: B
Answer: B
A population's carrying capacity
A) may change as environmental conditions change.
B) can be accurately calculated using the logistic growth model.
C) increases as the per capita population growth rate decreases.
D) can never be exceeded.
Answer: A
Scientific study of the population cycles of the snowshoe hare and its predator, the lynx, has revealed that
A) predation is the dominant factor affecting prey population cycling.
B) hares and lynx are so mutually dependent that each species cannot survive without the other.
C) both hare and lynx population sizes are affected mainly by abiotic factors.
D) the hare population is r-selected and the lynx population is K-selected.
Answer: A
Analyzing ecological footprints reveals that
A) Earth's carrying capacity would increase if per capita meat consumption increased.
B) current demand by industrialized countries for resources is much smaller than the ecological footprint of those countries.
C) it is not possible for technological improvements to increase Earth's carrying capacity for humans.
D) the ecological footprint of the United States is large because per capita resource use is high.
Answer: D
Based on current growth rates, Earth's human population in 2019 will be closest to
A) 2.5 million.
B) 4.5 billion.
C) 7.5 billion.
D) 10.5 billion.
Answer: C
The observation that members of a population are uniformly distributed suggests that
A) resources are distributed unevenly.
B) the members of the population are competing for access to a resource.
C) the members of the population are neither attracted to nor repelled by one another.
D) the density of the population is low.
Answer: B
According to the logistic growth equation below, = rN
A) the number of individuals added per unit time is greatest when N is close to zero.
B) the per capita population growth rate increases as N approaches
C) population growth is zero when N equals K.
D) the population grows exponentially when K is small.
Answer: C
During exponential growth, a population always
A) has a constant per capita population growth rate.
B) quickly reaches its carrying capacity.
C) cycles through time.
D) loses some individuals to emigration.
Answer: A
Which of the following statements about human populations in industrialized countries is incorrect?
A) Birth rates and death rates are high.
B) Average family size is relatively small.
C) The population has undergone the demographic transition.
D) The survivorship curve is Type I.
Answer: A