
Find the critical value z Subscript alpha divided by 2 that corresponds to the given confidence level. 82%

Find the critical value z Subscript alpha divided by 2 that corresponds to the given confidence level.93%
Za/2= 1.81
1-.93 = 0.07 / 2 = 0.035
invNORM(0.035) = -1.81
Find the critical value Za/2= that corresponds to alpha=0.05.
Za/2= 1.96
0.05 / 2 = 0.025
invNORM(0.025) = 1.96
.

Use the sample data and confidence level given below to complete parts (a) through (d).A research institute poll asked respondents if they felt vulnerable to identity theft. In the poll, n equals 909 and x equals 538 who said "yes." Use a 99 % confidence level.
a) Find the best point estimate of the population proportion p. = 0.592
- STAT -->TEST-->1-PropZInt (enter: n,x,c-level)
b) Identify the value of the margin of error E.E = 0.0420
- minus 0.634 from 0.592 = 0.0420
c) Construct the confidence interval. 0.550 < 0.634
One has 99% confidence that the interval from the lower bound to the upper bound actually does contain the true value of the population proportion.
A clinical trial tests a method designed to increase the probability of conceiving a girl. In the study 340 babies were born, and 289 of them were girls. Use the sample data to construct a 99% confidence interval estimate of the percentage of girls born. Based on the result, does the method appear to be effective?
0.800 < p < 0.900
STAT -->TEST-->1-PropZInt (enter: n,x,c-level)
Yes, the proportion of girls is significantly different from 0.5.
In the week before and the week after a holiday, there were 10,000 total deaths, and 4938 of them occurred in the week before the holiday.a. Construct a 95% confidence interval estimate of the proportion of deaths in the week before the holiday to the total deaths in the week before and the week after the holiday. b. Based on the result, does there appear to be any indication that people can temporarily postpone their death to survive the holiday?
0.485 <p< .504
No, because the proportion could easily equal 0.5. The interval is not less than 0.5 the week before the holiday.
A genetic experiment with peas resulted in one sample of offspring that consisted of 444 green peas and 162 yellow peas.a. Construct a 90% confidence interval to estimate of the percentage of yellow peas.b. It was expected that 25% of the offspring peas would be yellow. Given that the percentage of offspring yellow peas is not 25%, do the results contradict expectations?
a. Construct a 90% confidence interval. Express the percentages in decimal form.0.238 < p < 0.297
- 444 + 162 = 606
- n = 606, x = 162, c-level = 90%
- STAT -->TEST-->1-PropZInt (enter: n,x,c-level)
No, the confidence interval includes 0.25, so the true percentage could easily equal 25%
An online site presented this question, "Would the recent norovirus outbreak deter you from taking a cruise?" Among the 34,836 people who responded, 64% answered "yes." Use the sample data to construct a 95% confidence interval estimate for the proportion of the population of all people who would respond "yes" to that question. Does the confidence interval provide a good estimate of the population proportion?
0.635 < p< 0.645
- 34,836 x 0.64 = 22,296
- n = 34,836, x =22,296, c-level = 95%
- STAT -->TEST-->1-PropZInt (enter: n,x,c-level)
No, the sample is a voluntary sample and might not be representative of the population. This is the correct answer.
Recall the assumptions required in order to construct a confidence interval for estimating a population proportion. The sample should be a simple random sample. There should be a fixed number of trials, the trials should be independent, there should be two categories of outcomes, and the probabilities remain constant for each trial. There should be at least 5 successes and at least 5 failures.
In a poll of 557 human resource professionals, 48.1% said that body piercings and tattoos were big grooming red flags. Complete parts (a) through (d) below.
a) Among the 557 human resource professionals who were surveyed, how many of them said that body piercings and tattoos were big grooming red flags? 268
- n = 557, x 268, c-level = 99% and then 80% for questions c
b) Construct a 99% confidence interval estimate of the proportion of all human resource professionals believing that body piercings and tattoos are big grooming red flags. 0.427 <p< 0.536
STAT -->TEST-->1-PropZInt (enter: n,x,c-level)
c) Repeat part (b) using a confidence level of 80%. 0.454 <p< 0.508
STAT -->TEST-->1-PropZInt (enter: n,x,c-level)
d) Compare the confidence intervals from parts (b) and (c) and identify the interval that is wider. Why is it wider?
The 99% confidence interval is wider than the 80% confidence interval. As the confidence interval widens, the probability that the confidence interval actually does contain the population parameter increases.
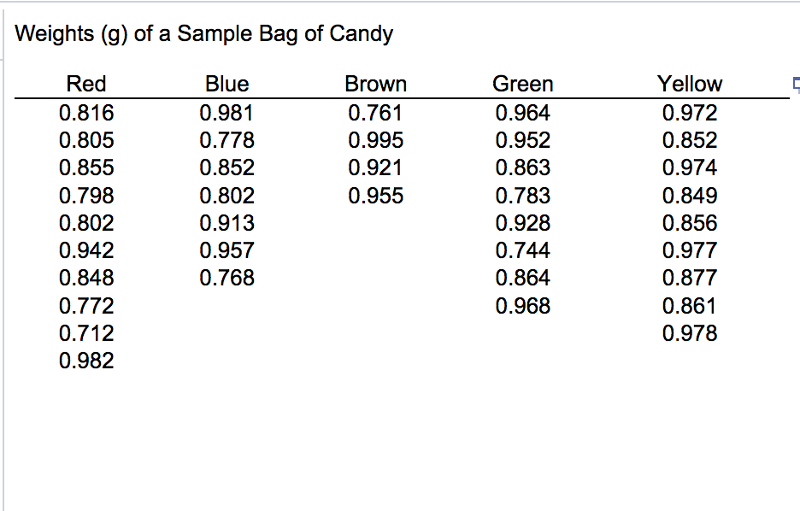
Find the sample proportion of candy that are red.
The proportion of red candy = 0.263
10 red candies
38 total candies
10 / 38 = 0.263
Use that result to construct a 95 % confidence interval estimate of the population percentage of candy that are red.
Use that result to construct a 95 % confidence interval estimate of the population percentage of candy that are red. 12.3% < p < 40.3
- STAT -->TEST-->1-PropZInt (enter: n,x,c-level)
- results x 100 = %
Is the result consistent with the 30 % rate that is reported by the candy maker?
Yes, because the confidence interval includes 30%.
During a period of 11 years 661 of the people selected for grand jury duty were sampled, and 74% of them were immigrants. Use the sample data to construct a 99% confidence interval estimate of the proportion of grand jury members who were immigrants. Given that among the people eligible for jury duty, 69.8% of them were immigrants, does it appear that the jury selection process was somehow biased against immigrants?
0.697 <p< 785
No, the confidence interval includes the true percentage of immigrants.
A study of 420,003 cell phone users found that 134 of them developed cancer of the brain or nervous system. Prior to this study of cell phone use, the rate of such cancer was found to be 0.0217% for those not using cell phones. Complete parts (a) and (b).
a. Use the sample data to construct a 90% confidence interval estimate of the percentage of cell phone users who develop cancer of the brain or nervous system. 0.027% <p< 0.036%
n = 420,003, x = 134, c = 90%
- STAT -->TEST-->1-PropZInt (enter: n,x,c-level)
- results x 100 = %
b. Do cell phone users appear to have a rate of cancer of the brain or nervous system that is different from the rate of such cancer among those not using cell phones? Why or why not?
Yes, because 0.0217% is not included in the confidence interval
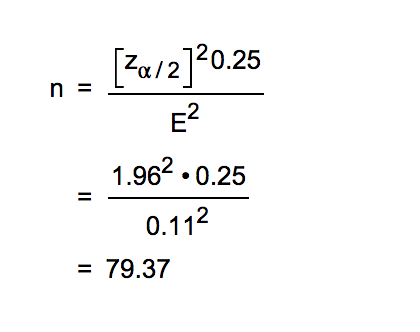
Use the given data to find the minimum sample size required to estimate a population proportion or percentage.Margin of error: 0.11; confidence level 95%; = p with hat and q with hat unknown
when p and q are unknown they are 0.25
n= 79.37 = 80 (Round up to the nearest integer.)
Formula in picture
1-0.95 = 0.05 / 2 = 0.025
Za/2 = 0.025, invNORM(0.025) = 1.96
pq = 0.25
Use the given data to find the minimum sample size required to estimate a population proportion or percentage.Margin of error: nine percentage points; confidence level 95%; from a prior study, p with hat is estimated by the decimal equivalent of 56%
n=117 (Round up to the nearest integer.)
- Look at picture in q. 15 for formula
- 1-0.95 = 0.05 / 2 = 0.025
- Za/2 = 0.025, invNORM(0.025) = 1.96
- Margin of error = 0.08
- p = 0.56
- q= 0.44
Find the sample size, n, needed to estimate the percentage of adults who have consulted fortune tellers. Use a 0.08 margin of error, use a confidence level of 95%, and use results from a prior poll suggesting that 12% of adults have consulted fortune tellers.
n = 64
- Look at picture in q. 15 for formula
- 1-0.95 = 0.05 / 2 = 0.025
- Za/2 = 0.025, invNORM(0.025) = 1.96
- p = .12
- q = .88