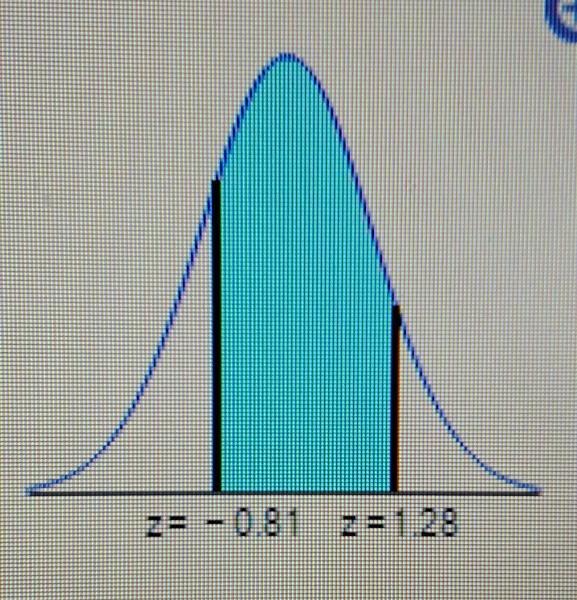
ind the area of the shaded region. The graph depicts the standard normal distribution of bone density scores with mean 0 and standard deviation 1.
The area of the shaded region is [_] 4 decimal places
Use appendix A
The area of the shaded region is . 8461.
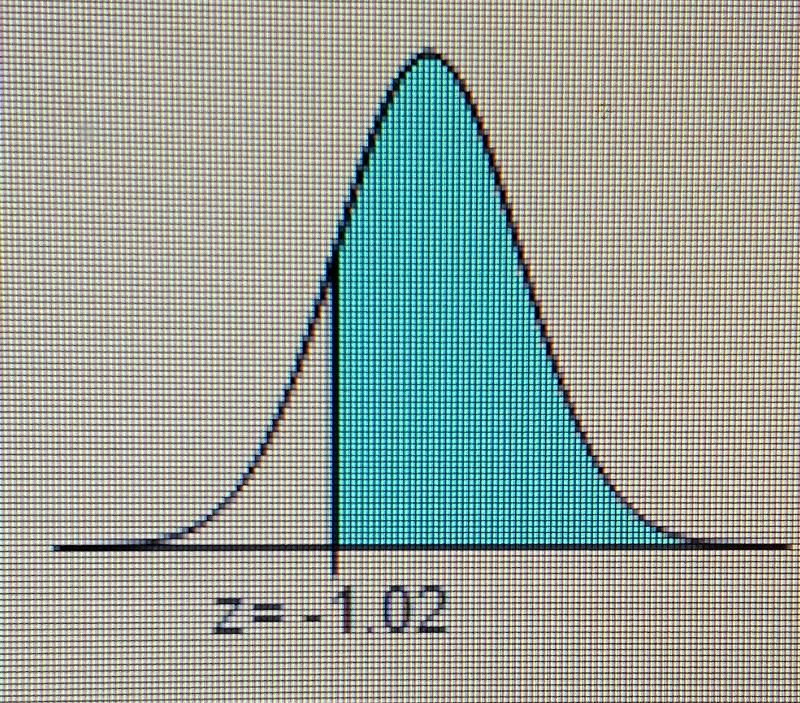
Find the area of the shaded region. The graph depicts the standard normal distribution of bone density scores with mean 0 and standard deviation 1.
The area of the shaded region is . [_] (Round to four decimal places as needed.)
Use appendix A
The area of the shaded region is . 6908.
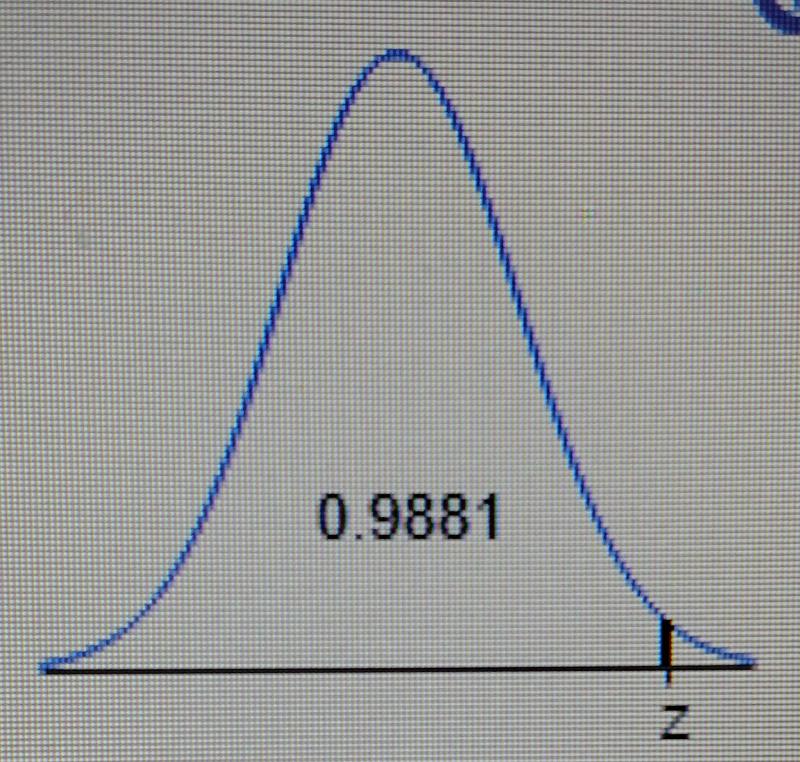
Find the indicated z score. The graph depicts the standard normal distribution with mean 0 and standard deviation 1.
The indicated z score is [_].(Round to two decimal places as needed.)
Use appendix A
The indicated z score is 2.26
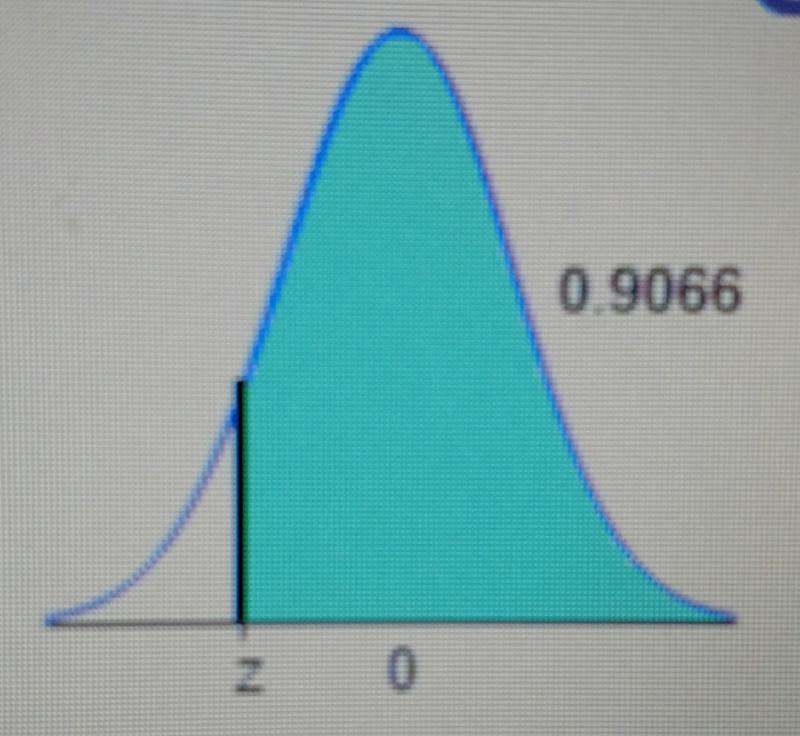
Find the indicated z score. The graph depicts the standard normal distribution with mean 0 and standard deviation 1.
The indicated z score is [_].(Round to two decimal places as needed.)
The total area under the standard normal distribution density curve is equal to 1. Note that the given area corresponds to the cumulative area from the right up to the indicated z score. Find the cumulative area from the left up to the indicated z score.1 − 0.9066 = 0.0934
Use technology and identify the corresponding z score, rounding to two decimal places.The cumulative area 0.0934 corresponds to a z score of -1.32. Thus, the indicated z score is -1.32.
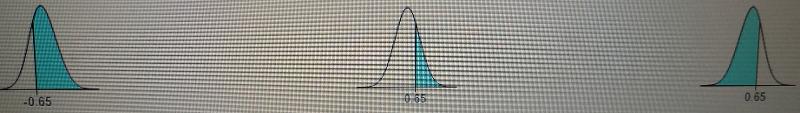
Assume the readings on thermometers are normally distributed with a mean of 0 degrees°C and a standard deviation of 1.00 degrees°C. Find the probability that a randomly selected thermometer reads greater than 0.65 and draw a sketch of the region.
The probability is [_]. (Round to four decimal places as needed.)
Graph B is correct
Use the table provided
First look up what 0.65 corresponds to on the table.
0.65 corresponds to 0.7422
Next take 1 - 0.7422 to get 0.2578
Then look up what 0.2578 corresponds to on the table.
0.2578 corresponds to -0.65.
Thus, the probability is 0.2578.
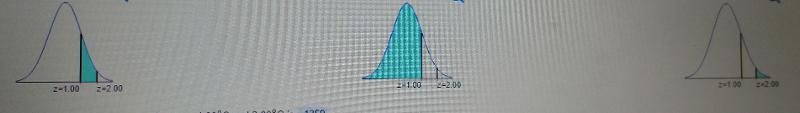
Assume that thermometer readings are normally distributed with a mean of 0 degrees°C and a standard deviation of 1.00 degrees°C. A thermometer is randomly selected and tested. For the case below, draw a sketch, and find the probability of the reading. (The given values are in Celsius degrees.) Between 1.00 and 2.00.
Draw a sketch. Choose the correct graph below.
The probability of getting a reading between 1.00 degrees°C and 2.00 degrees°C is [_]. 1359.(Round to four decimal places as needed.)
Graph A is correct.
Hit "2nd" "VARS"
Hit option 2; normalcdf( should show up.
Then enter your values separated by a comma.
normalcdf(1.00,2.00)
then hit enter
The probability of getting a reading between 1.00 degrees°C and 2.00 degrees°C is 1359.
Assume that a randomly selected subject is given a bone density test. Bone density test scores are normally distributed with a mean of 0 and a standard deviation of 1. Draw a graph and find Upper P 17, the 17th percentile. This is the bone density score separating the bottom 17% from the top 83%.
Which graph represents Upper P 17? Choose the correct graph below.
The bone density score corresponding to Upper P 17 is [_].(Round to two decimal places as needed.)
Graph D is correct
Hit "2nd" "VARS"
The hit option 3; invNorm( should show up
Enter in the % you are looking for.
invNorm(0.17)
Then hit enter
The bone density score corresponding to Upper P 17 is −0.95.
Find the indicated critical value.z 0.07
z0.07= [_] (Round to two decimal places as needed.)
First take 1 - 0.07 = 0.93
Hit "2nd" "VARS"
Hit option 3; invNorm( should show up.
Enter the number you got from taking 1 - 0.07 = 0.93
invNorm(0.93)
z0.07= 1.48
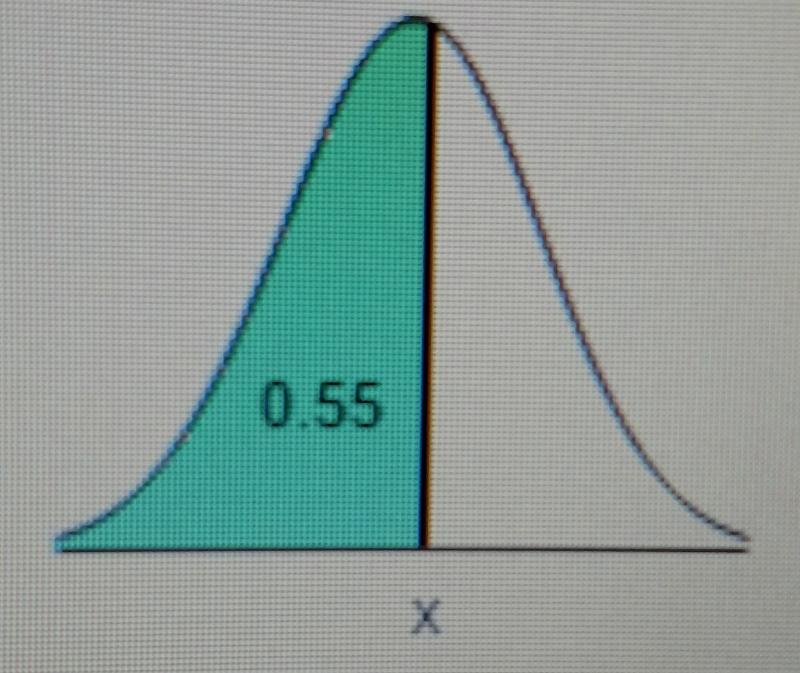
Find the indicated IQ score. The graph to the right depicts IQ scores of adults, and those scores are normally distributed with a mean of 100 and a standard deviation of 15.
The indicated IQ score, x, is [_]. (Round to one decimal place as needed.)
First find the z score that corresponds to an area of 0.55.
Hit "2ND" "VARS"
Then hit option 3; invNorm(
The enter the area you were given. invNorm(0.55)
The z score that corresponds to an area of 0.55 is 0.13
Convert a standard normal random variable z to a normal random variable x by using the formula below, where μ is the mean and σ is the standard deviation.
x = μ + (z *σ )
μ = 100
σ = 15
x = 100 + (0.13 * 15) = 101.95
Assume that adults have IQ scores that are normally distributed with a mean of 106 and a standard deviation of 15. Find the third quartile Q3, which is the IQ score separating the top 25% from the others.
The third quartile, Q3, is [_]. (Round to one decimal place as needed.)
Hit "2ND" "VARS"
Then hit option 3; invNorm(
The enter the area you were given. We know it is 0.75 because they said Q3.
invNorm(0.75)
The z score that corresponds to an area of 0.75 is 0.67
Convert a standard normal random variable z to a normal random variable x by using the formula below, where μ is the mean and σ is the standard deviation.
x = μ + (z *σ )
μ = 106
σ = 15
x = 106 + (0.67 * 15) = 116.05
The third quartile, Q3, is 116.05
A survey found that women's heights are normally distributed with mean 63.8 in and standard deviation 2.4 in. A branch of the military requires women's heights to be between 58 in and 80 in.
a. Find the percentage of women meeting the height requirement. Are many women being denied the opportunity to join this branch of the military because they are too short or too tall?
b. If this branch of the military changes the height requirements so that all women are eligible except the shortest 1% and the tallest 2%, what are the new height requirements?
Find these two areas by first converting the normal random variables, x, to standard normal random variables, z, using the formula below, where μ is the mean and σ is the standard deviation.
z = (x-u)/σ
x−μσ
Find the corresponding z score for the minimum height requirement of 58 in, using
μ= 63.8
σ = 2.4
x = 58 or 80
and rounding to two decimal places.
(58 - 63.8) / (2.4) = -2.42
Find the corresponding z score for the maximum height requirement of 80 in, rounding to two decimal places
(80 - 63.8) / (2.4) = 6.75
Therefore, the z score corresponding to the minimum height requirement is
z = -2.42
and the z score corresponding to the maximum height requirement is
z = 6.75.
Hit "2ND" "VARS"
Hit option 2
normalcdf(
enter your left and right z scores separated by a comma
normalcdf(-2.42,6.75) = 0.9922397
Therefor 99.22% of women meet the height requirements.
b)
The z score with an area of 1%, or 0.01, to its left is - 2.33.
Convert the standard normal random variable z to the normal random variable x using the formula below, where μ is the mean and σ is the standard deviation.
x=μ+(z•σ)
Find the new minimum height requirement, rounding to one decimal place.
x = μ+(z•σ)
x = 63.8 + (−2.33•2.4) = 58.208
Use similar steps to find the new maximum height. First find the z score with 2% of the total area under the standard normal curve to its right or 100%−2%=98% of the total area under the standard normal curve to its left.The z score with an area of 98%, or 0.98, to its left is 2.05.
Find the new maximum height requirement, rounding to one decimal place.
x=μ+(z•σ)
x=63.8+(2.05•2.4) = 68.72
The lengths of pregnancies are normally distributed with a mean of 266 days and a standard deviation of 15 days.
a. Find the probability of a pregnancy lasting 309 days or longer.
b. If the length of pregnancy is in the lowest 44%, then the baby is premature. Find the length that separates premature babies from those who are not premature.
conver 266 to its corresponding z-score.
Use the fact that z = (x−μ) /σ.
z = (309-266)/15 = 2.87
The normal distribution table gives the cumulative area under the curve to the left of the z-score. Recall that the area under the normal curve is equal to 1. To find the area under the curve to the right of the z-score subtract the cumulative area to the left of the z-score from 1.Use a normal distribution table given to find the cumulative area to the left of z = 2.87.
P(z < 2.87) = 0.9979
Now subtract the area 0.9979 from 1 to find the area of the shaded region.
Shaded area = 1 − 0.9979 = 0.0021
Thus, the probability that a pregnancy will last 266 days or longer is
b.
In order to determine the length of pregnancy that separates the premature babies from those who are not premature, draw a normal curve and shade the area corresponding to the lowest 44%.
Use a standard normal distribution table to find the z-score that corresponds to the lowest 44%. Start by looking in the body of the table and finding the value closest to 0.04.
The area closest to 0.04 is 0.0401.
Find the corresponding z-score for 0.0401.
The corresponding z value is −1.75
To obtain the x-value use the fact that x = μ+(z•σ).
x =266 + (−1.75 *15) almost equals≈239.75
Thus, babies who are born on or before 240 days are considered premature.
Assume that the Richter scale magnitudes of earthquakes are normally distributed with a mean of 1.117 and a standard deviation of 0.548. Complete parts a through c below.
a. Earthquakes with magnitudes less than 2.000 are considered "microearthquakes" that are not felt. What percentage of earthquakes fall into this category?
[_]%(Round to two decimal places as needed.)
The next step is to convert to its corresponding z-score. Use the fact that z=(x−μ)/σ, rounding to two decimal places.
z = (2.0-1.117)/0.548 = 1.611314
Use technology to find the cumulative area to the left of 1.61, rounding to four decimal places.
P (z < 1.61) =
Hit "2ND" "VARS" "2"
normalcdf(
enter your z value then a comma and then -100 cause you want to find the comulative area to the left of 1.61
normalcdf(1.61,-100) = -.946301
Therefore, 94.63% of earthquakes fall into the microearthquake category.
b.
The next step is to convert to its corresponding z-score. Use the fact that z=(x−μ)/σ, rounding to two decimal places.
z = (4.0 - 1.117)/0.548 =
A standard normal distribution table or technology can be used to find the area under the normal curve. For this explanation, technology will be used.
Use technology to find the cumulative area to the left of 5.2609, rounding to four decimal places.
P(z<5.2609) = 1.0000
P (z < 5.2609) =
Hit "2ND" "VARS" "2"
normalcdf(
enter your z value then a comma and then -100 cause you want to find the comulative area to the left of 5.2609
normalcdf(5.26,-100)
= 1.0000
Now subtract the area 1.0000 from 1 to find the area of the shaded region.
1 − 1.0000 = 0.0000
Therefore, 0.00% of earthquakes will have a magnitude above 4.0 and will cause indoor items to shake.
c)
Find the z score that corresponds to an area of 0.9500, rounding to three decimal places.
z=1.645
With z=1.645, u = 1.117, and σ =0.548, solve for x by using the following formula, rounding to three decimal places.
x = μ+ (z *σ) =
x = 1.117 + (1.645 * 0.548) = 2.018
Therefore, 95% of earthquakes have a magnitude of 2.018 or lower.
Will all earthquakes above the 95th percentile cause indoor items to shake?
Only earthquakes with magnitudes above 4.0 will cause indoor items to shake. The 95th percentile for earthquake magnitudes is 2.018.
Use this information to determine if all earthquakes above the 95th percentile will cause indoor items to shake.
Assume a population of 22, 33, and 10. Assume that samples of size n = 2 are randomly selected with replacement from the population. Listed below are the nine different samples. Complete parts a through d below.
2,2
2,3
2,10
3,2
3,3
3,10
10,2
10,3
10,10
a. Find the value of the population standard deviation σ.
σ = [_] (Round to three decimal places as needed.)
First calculate the population mean, rounding to two decimal places.
First calculate the population mean, rounding to two decimal places.
μ = (Sum of population values)/ (Number of population values)
(2+3+10)/(3) = 5
Now calculate the population standard deviation, rounding to three decimal places. Substitute the values for x and μ = 5 into the population standard deviation formula.
σ = square root ∑(x−μ)2 / N
square root (2 - 5)^2 + (3 -5)^2 + (10-5)^2 / 3
= 3.559
• Press [STAT] [ENTER] to enter the statistics list editor
•
Enter the numbers into the list by pressing each number and [ENTER]
• Press [STAT] [right cursor] to enter the CALC menu
•
Select 1:1-Var Stats, 1-Var Stats will be typed on the home screen,
press [ENTER]
• The statistics will be displayed (The cursor keys
can be used to scroll through the entire list of results)
b)
While either technology or the formula below can be used to find each sample standard deviation, where "x" is the sample mean and n is the sample size, for this exercise, use the following formula.
s = StartRoot ∑x−x2 /n−1
Press [2nd], [LIST], scroll to MATH and select 7:stdDev(
•
Press [2nd] [(] [2] [,] [3] [,] [5] [,] [1] [,] [4] [2nd] [)]
[)]
• The screen should now display 'stdDev({2,3,5,1,4})'
•
Press [ENTER] and the standard deviation of the list will be displayed
c)
Find the mean of the sampling distribution of the sample standard deviations. The mean of the sample standard deviations is the sum of the nine sample standard deviations divided by the number of samples.Calculate the mean of the sample standard deviations, rounding to three decimal places.
(0.0 + 0.0 + 0.0 +0.707 + 0.707 +4.95 + 4.95 +5.657 +5.657) / 9 = 2.5142