If there are 150,000 records and the HIM Department receives 3,545 requests for records within a given period of time, what is the request rate?
A. 2.4% B. 3.5% C. 4.6% D. 5.1%
3545/150,000=0.0236 *100% =2.36
2.4%
A new Health Information Department has purchased 200 units of 6-shelf files and plans to implement a terminal digit filing system. How many shelves should be allocated to each primary number?
A. 6 B. 8 C.10 D. 12
200 X 6= 1,200
remember there are 100 primary numbers (00-99)
1200/100 primary numbers
12 shelves per primary number
Out of 2,543 records requested from the HIM Department 2,375 were located. What is the filing accuracy rate?
A. 6.61% B. 75.33% C. 89.01% D. 93.39%
2,375/2543=0.9339*100=93.39%
93.39%
A HIM Department, currently using 2,540 linear filing inches to store records, plans to purchase new open shelf filing units. Each of the shelves in a new 6 shelf unit measures 36 linear filing inches. It is estimated that an additional 400 filing inches should be planned for to allow for 5 year expansion needs. How many new file shelving units should be purchased?
A. 11 B. 12 C. 13 D. 14
2540+400=2940
6X36=216
2940/216=13.61
14
If the HIM Department has purchased 100 units of 8 shelf files and plans to use the terminal digit filing system, how many shelves should be allocated to each primary number?
A. 8 B.10 C. 12 D. 100
100X8=800/100(primary number goes up to 100)=8
8
At Community Hospital the average admission will create a file that will take up 0.25 inch of file space. Each new ER record requires 0.125 inch of file space. Approximately 25,000 new patients are admitted per year and 15,000 ER patients are treated per year. The shelving cost is $1.05 per filing inch. How much money should be allocated for storage space in next year's budget?
A. $8,531.25 B. $8,125.00 C. $853.25 D. $1875.00
0.25 X 25,000=6250
0.125 X 15000= 1875
1875+6250=8125
8125*$1.05=$8531.25
$8531.25
A HIM Department wants to buy new open shelf filing units for its file expansion. Each of the shelves in a new 6-shelf unit measures 33 linear filing inches. There will be an estimated 1,000 records to file. The average record is 1-inch thick. How many units should be purchased?
A. 2 B.4 C. 6 D.8
6x33=198
1000 X 1= 1000
1000/198=5.05
6 is the answer
Palm Beach Healthcare Center has been in operation for 13 years. It has 6,000 admissions per year. The facility has expanded and will allow for 200 more admissions per year from now on. There are 2,500 linear feet of filing space available and half is being used. The facility expects a 30% readmission rate. If a unit numbering/filing system is used, how many file folders will be needed for the next year?
A. 1,800 B. 1,860 C. 4,340 D. 6,200
6000 + 200=6200
6,200 X .30= 1860
6200-1860= 4340
4,340
The HIM Department maintains 500,000 records and responds to 5,000 requests for records in a given period of time. What is the record usage rate?
A. 0.01% B. 1% C. 5% D. 10%
5,000/500,000=.01*100=1%
1%
The total number of records filed during the month is 2,500 and upon completion of a filing accuracy study, 90 records were not found. What is the accuracy rate for filing?
A. 1% B. 4% C. 28% D. 96%
2500-90=2410/2500
96%

The case-mix index (CMI) for the top 10 MS-DRGs above is
A. 1.164
B. 1.278
C. 0.782
D. 1.097
1.278
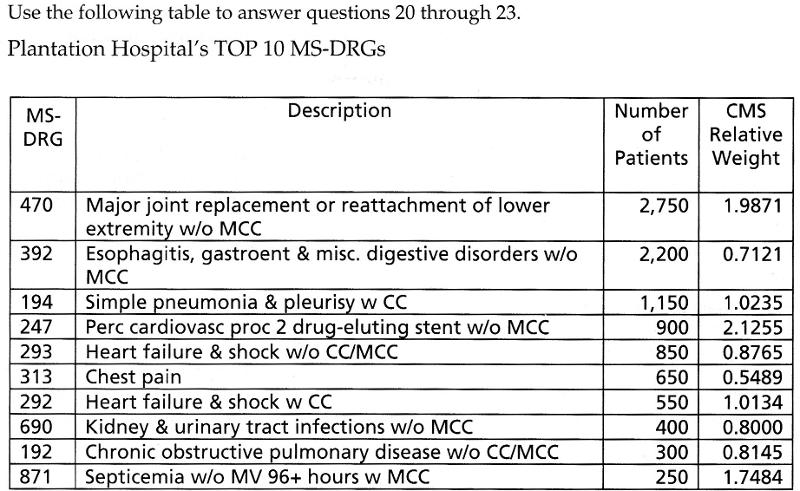
Which individual MS-DRGs has the highest reimbursement?
A. 247
B. 470
C. 871
D. 293
247

Based on the patient volume, during this time period, the MS-DRG that brings in the highest "total" reimbursement to the hospital is
A. 470
B. 247
C 392
D. 871
470

Based on the patient volume, the MS-DRG that brings in the highest total profit to the hospital is ?
A. 470
B. 247
C. 392
D. It cannot be determined from this information
D. It cannot be determined from this information
If the Medicare non-PAR APPROVED PAYMENT AMOUNT IS $128.00 for a proctoscopy, what is the total Medicare approved amount for a doctor who does not accept assignment, applying the limiting charge for this procedure?
A. $140.80
B. $143.00
C. $192.00
D. $147.20
The limiting charge applies to non-participating providers in the Medicare Part B program when they do not accept assignment. The limiting charge is 115 percent of the physician fee schedule amount.
$128.00 * 1.15%= $147.20
D. $147.20
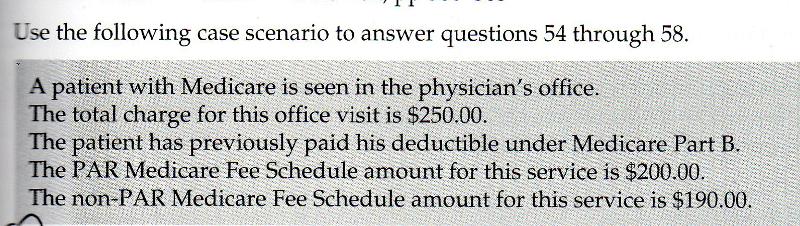
The patient is financially liable for the coinsurance amount, which is
A. 80% B. 100% C. 20% D. 15%
C. 20%

If the physician is a participating physician who accepts assignment for this claim, the total amount the physician will receive is:
A. $200.00 B. $250.00 C. $218.50 D. $190.00
A. $200.00

If the physician is a nonparticipating physician who does NOT accept assignment for this claim, the total amount the physician will receive is:
A. $250.00 B. $200.00 C. $218.50 D. $190.00
C. $218.50

If this physician is a participating physician who accepts assignment for this claim, the total amount of the patient's financial liability (out-of-pocket expense) is.
A. $200.00 B. $40.00 C. $160.00 D. $30.00
B. $40.00

If this physician is a nonparticipating physician who does NOT accept assignment for this claim, the total amount of the patient's financial liability (out-of-pocket expense ) is
A. $66.50 B. $38.00 C. $190.00 D. $152.00
A. $66.50
The coder works 7.5 hours per day. If a time standard is determined from sample observations to be 2.50 minutes per record for coding emergency room records, what is the daily standard for the number of records coded when a 15% fatigue factor is allowed?
Calculation: 7.5 hours × 60 minutes per hour = 450 minutes per
day
450 × 15% = 67.5
450 – 67.5 = 382.5
382.5/2.5 = 153
The correspondence section of your department receives an average of 50 requests per day for release of information. It takes an average of 30 minutes to fulfill each request. Using 6.5 productive hours per day as your standard, calculate the staffing needs for the correspondence section.
Calculation: 50 × 30 = 1,500
1,500/60 = 25
25/6.5 = 3.8

Based on the MS-DRG report above, what is the case-mix index for this facility?
169.051 total relative weight / 57 total patients seen = 2.965807
Sandy Beach Hospital reports 1,652 discharges for September. The infection control report documents 21 nonsocomial infections and 27 community -acquired infections for the same month What is the community acquired infection rate?
27x100= 2700/1652=1.6
ans. 1.6
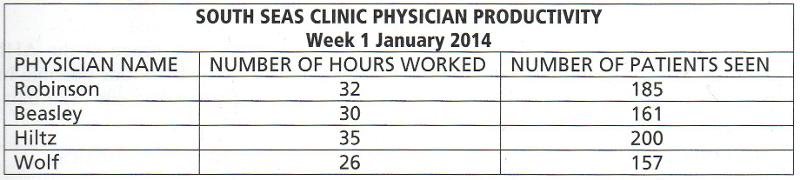
Physicians at South Seas Clinic are expected to see six patients per hour on average. The physicians with the highest productivity each week are exempted from on-call responsibilities for the weekend. Which physician will get the weekend off this week?
185/32=5.8
161/30=5.4
200/35=5.7
157/26=6.0 ans.
If there are 150,000 medical records and the Health Information Department receives 3,545 requests for records in a week, what percentage of the records are requested weekly?
3545*100=354500/150000= 2.36
2.4% ans.
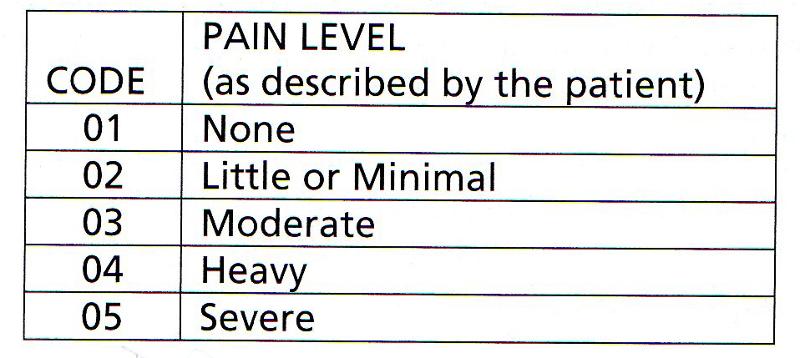
You are conducting a study on the pain associated with a specific illness. For the purpose of your study, you classify pain level as follows.
These data are best described as
A. discrete B. continuous C. nominal D. ordinal
D. Ordinal
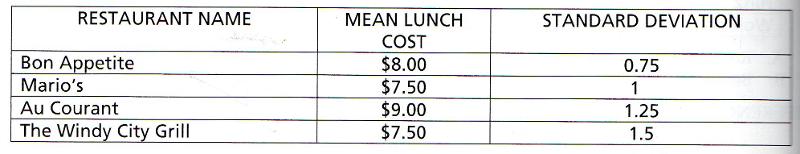
You are choosing restaurants where you might eat while you are in Chicago at the AHIMA Leadership Conference. You have collected the following information about four possible lunch restaurants that are all located within easy walking distance of the meeting site. The data are displayed below.
You want to stay within the reimbursement rate allowed by your Component State Association, so it is important to you that you have at least a 95% chance of eating a lunch that costs no more than $10.00. Therefore when lunchtime comes you head to
A. Bon Appetite or Mario's B. Mario's or Au Courant
C. Au Courant or The Windy City Grill
D. The Windy City Grill or Bon Appetite.
mean of lunch at Bon Appetite $8.00- .75-.75=$6.5
mean of lunch at Bon Appetite $8.00+.75+.75=$9.5
mean of lunch at Marios $7.50 - 1- 1 = $5.5
mean of lunch at Marios $7.50 + 1 + 1 = $9.50
mean of lunch at Au Courant $9.00 - 1.25 - 1.25= $6.50
mean of lunch at Au Courant $9.00 + 1.25 + 1.25 = $11.50
mean of lunch at The Windy City Grill $7.50 - 1.50 -1.50= $4.50
mean of lunch at The Windy City Grill $7.50 + 1.50 + 1.50 = $10.50
ans. Bon Appetite or Mario's
Organizations collect statistics to increase their knowledge of a specified population. The knowledge does not come automatically it is developed in the following sequence:
A. data--->facts--->information--->knowledge
B. data--->information --->facts--->knowledge
C. facts --->data--->information--->knowledge
D. facts--->information--->data--->knowledge
B. data--->information --->facts--->knowledge
If the physician is a nonparticipating physician who does NOT accept assignment for this claim, the total amount the physician will receive is:
A. $250.00 B. $200.00 C. $218.50 D. $190.00
C. $218.50
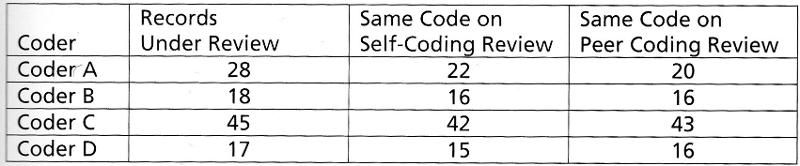
The coder with the highest overall accuracy rating will get the day after Thanksgiving off Which coder will get to spend the day after Thanksgiving off rather than coding?
A. Coder A. B. Coder B C. Coder C D. Coder D
Coder A: 22/28=78.57 20/28=71.43 78.57+71.43=150/2=75%
Coder B: 16/18=88.89 16/18=88.89 88.89+88.89=177.78/2=88.89%
Coder C: 42/45=99.33 43/45=95.56 99.33+95.56=194.89/2=94.45% ans.
Coder D: 15/17=88.24 16/17=94.12 94.12+ 88.24= 182.36/2=91.18%

A small portion of the form you are using for a research study is reproduced below.
This is an example of
A. ordinal data B. Ranked data C. nominal data D. discrete data
C. nominal data
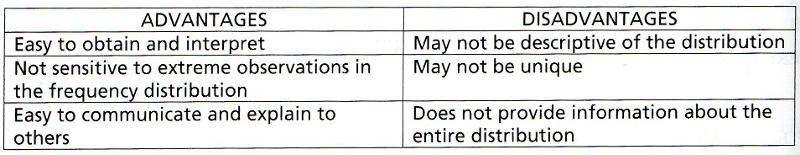
You have made a list of the advantages and disadvantages of a measure of central tendency.
The measure of central tendency you are describing is the
A. mean B. median C. range D mode
D. mode

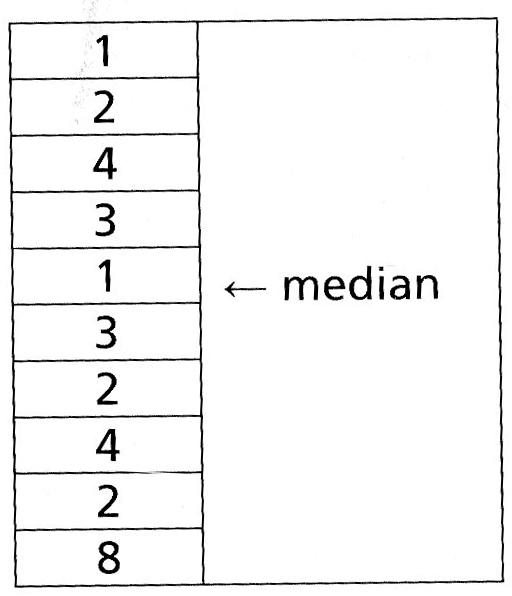
The following data were collected in your physician office practice from one morning's visits. Use the data for questions 12,13, and 14.
The median number of minutes with the physician (considering all physicians ) is
A. 7 mins B. 8 mins C. 8.4 mins D. 9 mins
B. 8 mins
put number in order 5,5,6,7,7,8,9,9,10,11,12 (find the middle)
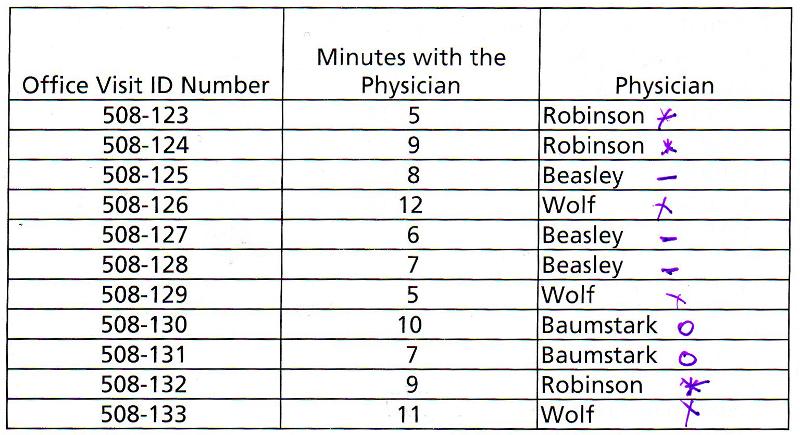
The mean number of minutes with the physician (considering all physicians is
A. 7 mins B. 8 mins C. 8.4 mins D. 9 mins
B. 8 mins
add all divide by 11
5+9+8+12+6+7+5+10+7+9+11=89/11=8.09

Which physician spent the longest average time with patients on that day?
A. Beasley B. Wolf C. Baumstark D. Robinson
Beasly 8+6+7=21/3=7
Wolf 12+5+11=28/3=9.3
Baumstark 10+7=17/2=8.5
Robinson 5+9+9=23/3=7.7
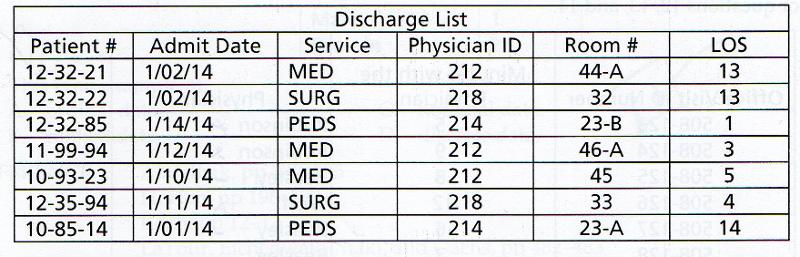
Without even performing any complex calculations, you can get a quick, simple measure of dispersion in the LOS for yesterday's discharges by computing the
A. range of the data set B. mean of the data set C. variance of the data set
D. coefficient of variation of the data set
A. range of the data set
simple measure of dispersion is the RANGE
Looking more closely at the LOS for these patients, when you calculate the standard deviation on the data, you would expect
A. a large standard deviation because the dispersion is large
B. a small standard deviation because the dispersion is small
C. a large standard deviation because the dispersion is small
D. a small standard deviation because the dispersion is large
A. a large standard deviation because the dispersion is large
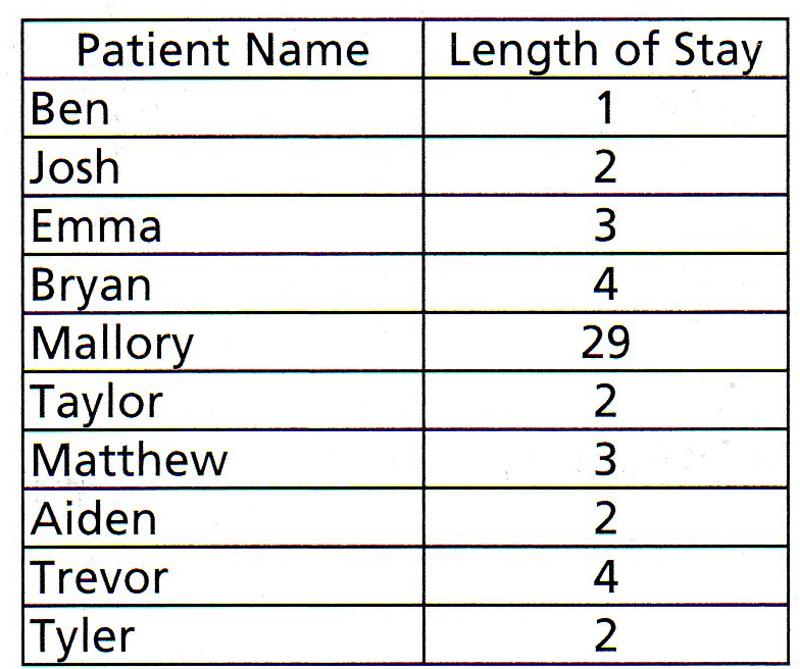
Englewood Health Center collected the following data on patients discharged on Jan. 1 2013. Which measure of central tendency would be mot affected by Mallory's extremely long LOS?
A. variance B. median C. mean D. mode
C. mean
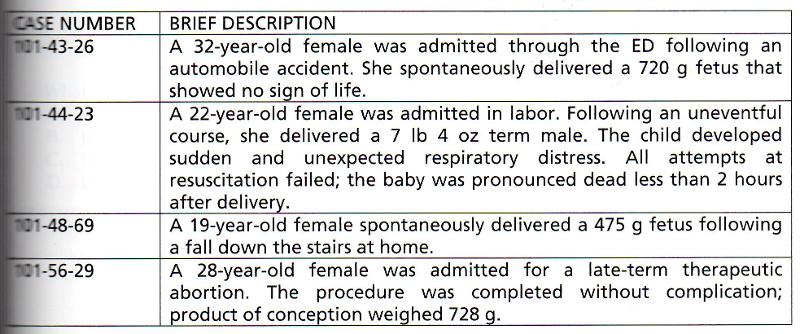
The OB/GYN Department reported the information in teh table shown above to the Quality Management/Statistics Committee. When the committee considers these adverse outcomes from the OB/GYN Department, which of the cases will be included int eh numerator of the facility's fetal death rate.
A. 101-43-26 B. 101-43-26 AND 101-44-23 C. 101-43-26 AND 101-48-69
D.101-43-26 AND 101-56-29
A. 101-43-26

Which of the cases listed in the table above will have an impact on the facility's gross death rate?
A. 101-43-26 B. 101-44-23 C. 101-48-69 D.101-56-29
B. 101-44-23
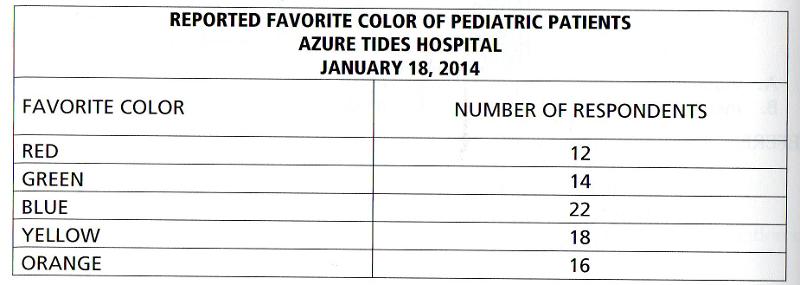
Patients in the pediatrics ward were studied to determine their favorite color The survey results are listed below. The results of the favorite color study are reported in a
A. frequency polygon B. line graph C. frequency distribution D . systematic fashion
C. frequency distribution
All of the following items mean the same thing, EXCEPT
A. inpatient service day B. Daily inpatient census C. daily census D. inpatient census
D. inpatient census
Pasadena Bay Hospital reports an average LOS in February of 3.7 days with a standard deviation of 20. This tells us that
A. most patients had an LOS of 3-4 days
B. there was a small variation in the LOS
C. patients at Pasadena BAy stay longer than average
D. there was a large variatION in the LOS
C. patients at Pasadena BAy stay longer than average
Jason collected data on the length of stay (LOS) for 10 patients and then determined the median LOS as follows:
What is wrong with Jason's determination of the median?
A. There is nothing wrong with Jason's determination of the median
B. Jason forgot to put the numbers in sequential order before determining the median
C. It is not possible to determine the median on such a small number of data points.
D. It is not possible to determine the median on an even number of data points.
B. Jason forgot to put the numbers in sequential order before determining the median
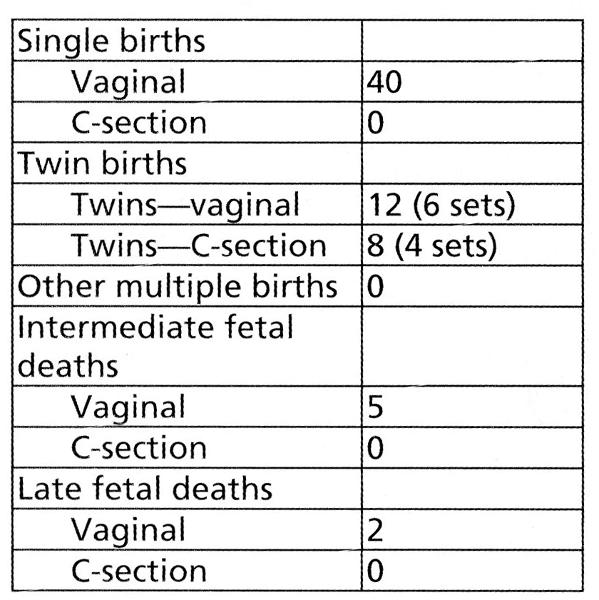
All Women's Hospital reports the following statistics:
How many deliveries occurred?
A. 50 B. 57 C. 60 D. 67
B. 57
The inpatient census at midnight is 67. Two patients were admitted in the morning, one died 2 hours later, the second patient was transferred to another facility that same afternoon. The inpatient service days for that day will be.
A. 65 B. 67 C 68 D. 69
D. 69
Bayside Hospital has 275 adult beds, 30 pediatric beds, and 40 bassinets. In a nonleap year, inpatient service days were 75,860 for adults, 7100 for pediatrics and 11,800 for newborns. What was sthe average daily census for the year.
A. 227 B. 208 C. 207 D. 259
75,860 + 7100=82960 (never ever count newborns)
82960/365=227
A. 227
In order to derive the total inpatient service days for any given day, you would need to
A. subtract intra hospital transfers from the inpatient census
B. add same-day admits and discharges to the inpatient census
C. add intra hospital transfers to the inpatient census
D. subtract same day admits and discharges from the inpatient census
B. add same-day admits and discharges to the inpatient census
Mrs. McDonaldson was admitted to your hospital at 10:45 p.m. on Jan. 1. He died at 4:22 am on Jan. 3. How many inpatient service days did Mr. McDonaldson receive?
A. 1 B. 2 C. 3 D. 4
B. 2
A patient admitted to the hospital on Jan. 24 and discharged on Feb 9 has a length of stay of
A. 16 days B 15 days C. 17 days D, 14 days
A. 16 days
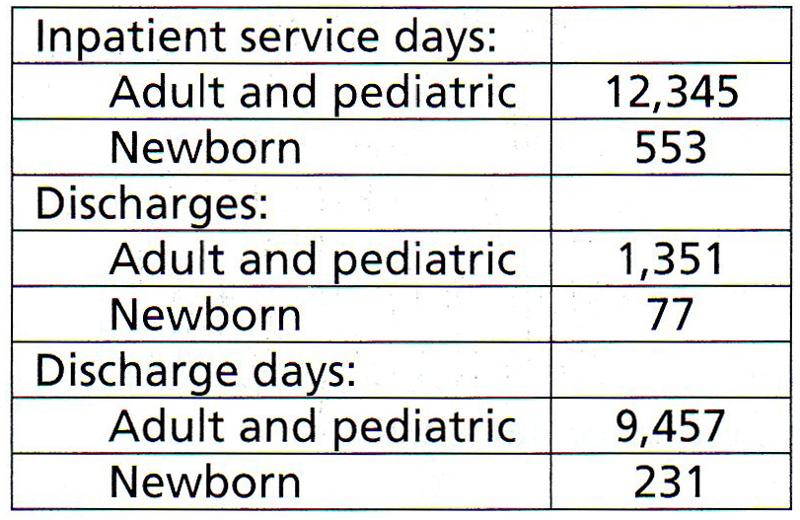
Royal Palm Hospital has 500 beds and 55 bassinets. In Feb. of a nonleap year, it reported the following statistics.
What was the percentage of occupancy for adults and pediatrics in Feb?
A. 84.8% B. 88.2% C. 79.6% D. 80.5%
12345*100=1234500
500*28 (nonleap year)=14000
1234500/14000=88.17= 88.2%

What was the average length of stay at Royal Palm Hospital in Feb.
A. 6.8 days B. 7 days C. 9 days D. 9.1 days
discharge days 9457/discharges 1351=7 days
B. 7 days
you are responsible for calculating and reporting average length of stay (ALOS) for your hospital each month. This Month, there were 92 discharges, and the total discharge days equal 875. ONe of the patients discharged this month had a total of 428 discharge days, so the ALOS is distorted by this unusually long stay. In this situation, you should report an ALOS of
A. 9.51 days-------no further information is necessary
B. 9.61 days and make a note tat the one patient with an unusually long LOS was subracted prior to making the calculation.
C. 4.86 days and make a note that one unusually long LOS was subtracted prior to makin the calculation.
D. 4.91 days and make a note that the data on one patient with an unusually long LOS were subtracted prior to making the calculation.
because of one patient had a discharge day of 428 subtract this from the total discharge days
875-428=447
92-1 (that one person who stayed the longest 428)=91
447/91=4.91
D. 4.91 days and make a note that the data on one patient with an unusually long LOS were subtracted prior to making the calculation.
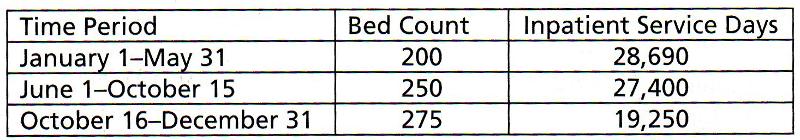
A hospital reported the following statistics during a nonleap year. Calculate the percentage of occupancy for the entire year.
A. 85.2% B. 88% C. 90.0% D. 91.2%
Jan1-may 31=151 days (200)=30200
june 1-oct 15=137 days (250)=34250
oct 16-dec 31=77 days (275)=21175
30200+34250+21175=85625
inpatient service days (28690+27400+19250)*100=7534000
7534000/85625=87.9%
B. 88%
Lake City Health Center has 200 beds and 20 bassinets. In a nonleap year, STyles Hospital admitted 16,437 adults and children; 16570 adults and children were discharged. There were 1,764 live births and 1,798 newborns discharged. The bed turnover rate for the year was
A. 82.2 B. 82.7 C. 82.9 D. 93.5
16570 total discharged/200 beds=82.85
82.9
C. 82.9
Sea Crest Hospital has 200 beds and 20 bassinets. There was a sudden spurt in the birth rate in the town in Nov. The hospital set five additional bassinets for the entire month. Total bed count days for Sea Crest Hospital in a nonleap year would be?
A. 73,000 B. 80,300 C. 80,450 D. 80,455
200* 365=73,000 (nonleap year)
Leap year =
nonleap year=
366 days
365 days non
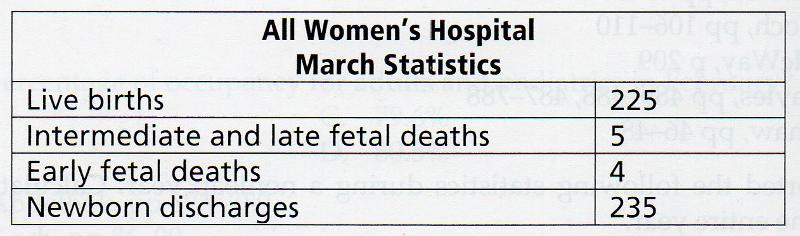
Use the statistics provided in the table to compute the fetal death rate at All Women's Hospital for March?
A. 4.0% B. 1.78% C. 2.2% D. 1.77%
5*100=500
225 + 5 = 230
500/230=2.17
2.2%
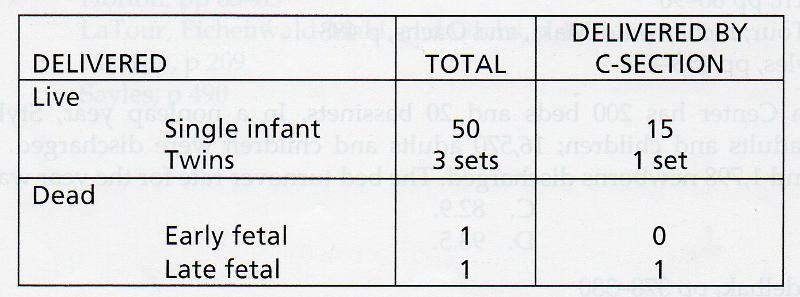
The following obstetrical statistics were collected for the month of October. Use the data in teh table below to answer the next two questions:
The number of births in the facilities in October?
A. 53 B. 55 C. 56 D. 58
50 (3 sets X 2 births per set)= 56 births

The number of deliveries in the facility in October is ?
A. 53 B. 55 C. 56 D. 58
50 + 3 + 1 (early fetal) + 1 (late fetal)= 55 deliveries
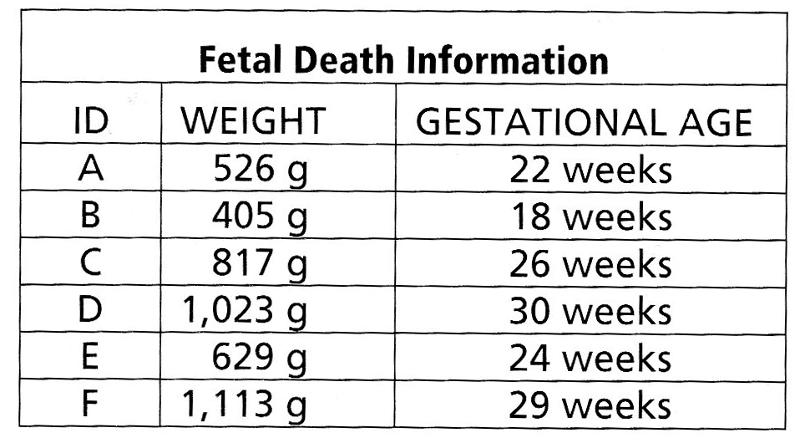
How should these deaths be counted in the hospital death rates?
A. All the deaths except B will be includedi n the gross death rate.
B. Deaths D and F will be included in the gross death rate
C. Deaths C, D, and F will be included in the gross death rate
D. None of these deaths will be included in the gross death rate.
D. None of these deaths will be included in the gross death rate.
William Rumple was pronounced dead on arrival (DOA). The hospital pathologist performed an autopsy on Mr. Rumple's body. This statistical event would be counted in the
A. net death rate
B. gross death rate
C. net autopsy rate
D. hospital autopsy rate.
D. hospital autopsy rate.

Tampa Bay Health Center discharged 6,069 adults/children and 545 newborns last year. A total of 1,648 adluts/children and 1,279 newborns were seen in the emergency department. Information on the deaths at Happy Valley last year is listed below. Use the data to answer the next two questions.
What was the gross (hospital ) death rate at Tampa BAy Health Center last year?
A. 3.8% B. 5.4% C. 5.5% D. 5.6%
6069+545=6614
245+8+2+105+3=363
363/6614=
5.48
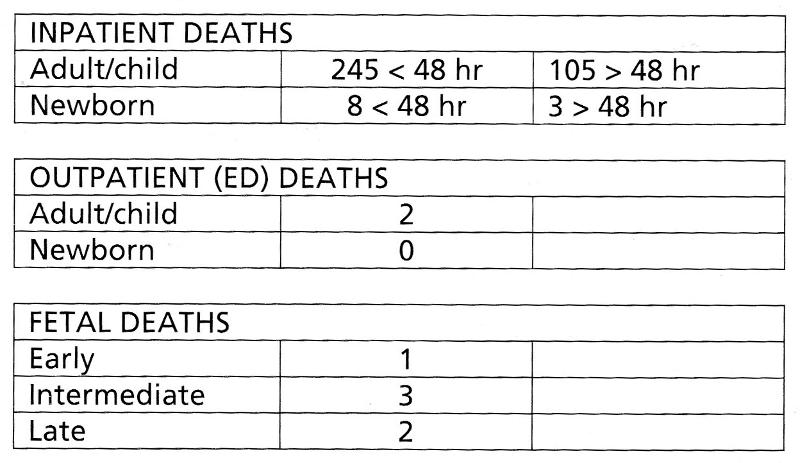
Tampa Bay Health Center discharged 6,069 adults/children and 545 newborns last year. A total of 1,648 adluts/children and 1,279 newborns were seen in the emergency department. Information on the deaths at Happy Valley last year is listed below. Use the data to answer the next two questions.
What was the net death rate at Tampa Bay Health Center last year?
A. 1.6% B. 1.7% C. 1.8% D. 1.9%
6069+545=6614
6614-245-8=6361
108 (>48 hrs.)/6361= 1.69
ans. 1.7
During the month of September, Superior Health Care Center had 1,382 inpatient discharges, including 48 deaths. There were 38 deaths over 48 hours. statistics also show 4 fetal deaths, 3 DOAs, and 4 inpatient coroner's cases. Which of the follwoing calculations is correct to figure the net death rate?
A. (48X100)/(1,382-10)
B. (48-10X100)/(1,382-10)
C. (1,382X100)/ (48-10)
D. (1,382-10)X100/(48-10)
B. (48-10X100)/(1,382-10)
The best form/graph for demonstrating tends over time would be
A. frequency polygon B. line graph C. pie chart D. histogram
B. line graph
Joseph Woodley has been on a third floor nursing unit since October 2012 and was finally discharged to a nursing home in December 2013. When the average length of stay is calculated for the year 2013, this very long length of stay will
A. have little impact on the average length of stay
B. result in a special cause variation in the average length of stay
c. result in a small variation in the average length of stay
D. result in a common cause variation in the average length of stay.
B. result in a special cause variation in the average length of stay
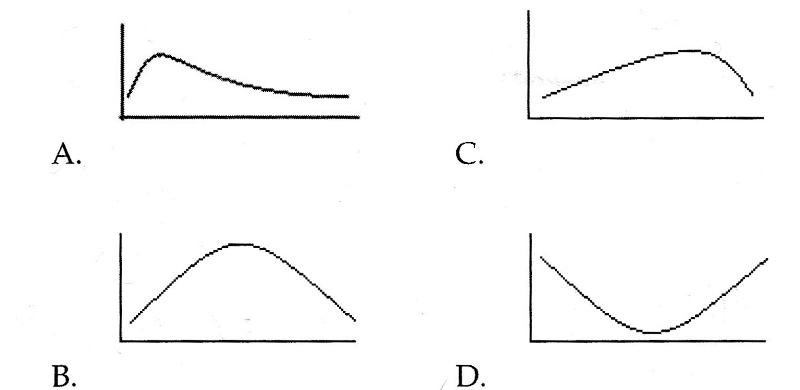
Still thinking about Mr. Woodley and his long stay, if you were to graph the ALOS for the faciltiy for 2013, which of the following graphs would you expect to see?
ans. C
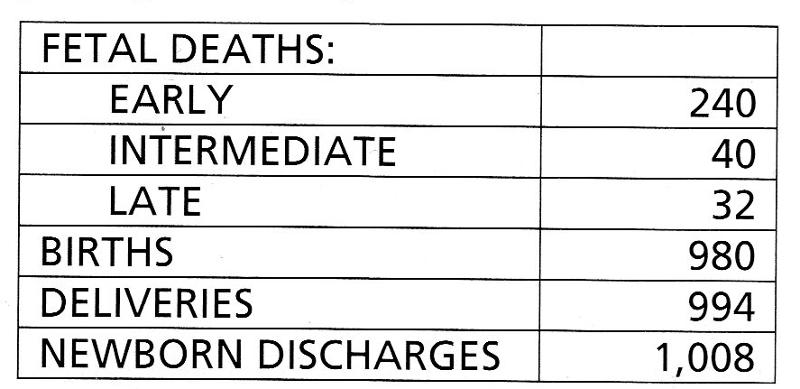
The New Beginnings Maternity Center recorded the following statistics in December:
What was the fetal death rate at New Beginnings Maternity Center in December?
A. 6.8% B. 7.3% C. 7.4% D. 31.8%
intermediate 40 + late 32 = 72x100. 7200
births 980 + 72 intermediate/late = 1052
7200/1052= 6.8%
ans. A
The statistics reported for a 300-bed hospital for 1 year were 20,932 discharges with 136,651 discharge days and 3,699 consultations performed. What was the consultation rate for the year?
A. 16.5% B, 17.0% C. 17.7% D. 18.0%
3,699x100=369,900
369,900/20,932=17.67
17.7%
ans. C
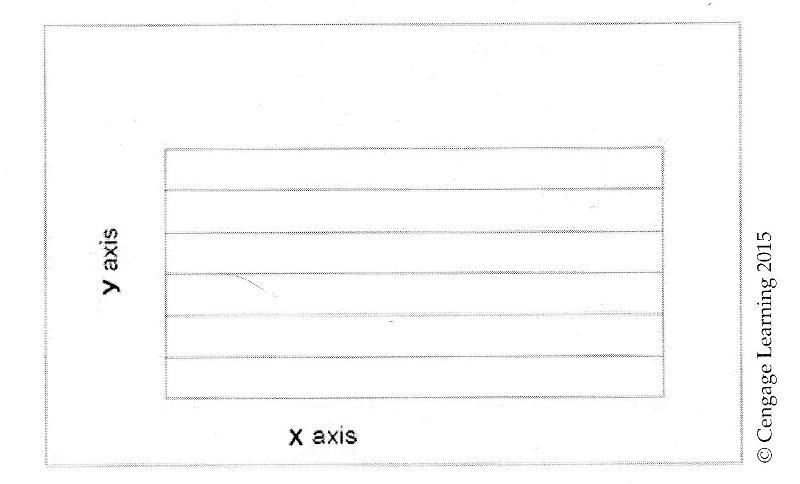
Look at the graph grid displayed above. If you want to follow accepted principles for graph construction, you will follow the three quarter high rule. That means
A. height of the graph should be three fourths the length of the graph
B. length of the graph should be three fourths the heights of the graph
C. height of the graph should display three fourths of the data in the graphs
D. length of the graph should display three-fourths of the data in the graph.
p522.
the three quarter high rule- the height (y-axis) of the graph should be three fourths the length (x-axis) of the graph.
ans. A
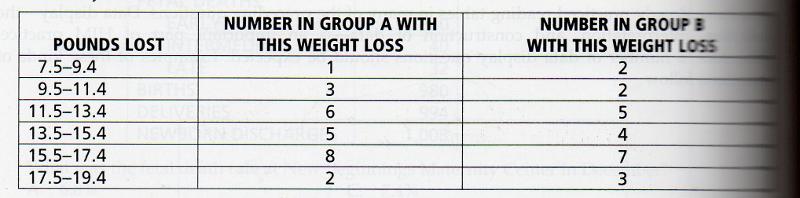
You are preparing data from a series of weight loss studies for display. The data collected during the study are as follows?
If you want to allow the reader to compare the results of Group A with those of Group B on one graphic display, your best choice would be to construct a.
A. bar chart B. line graph C. histogram D. frequency polygon
C. histogram
A distrubution is siad to be positively skewed when the mean is
A. bimodal B. multimodal C. shifted to the left D. shifted to the right
D. shifted to the right
You want to graph the number of patients admitted to three different medical staff services on each day of the last month. Because you have a large number of observations (one for each day of the month) and you want to be able to compare the observations for each of the three services on one data display, your best choice is a
A. table B. bar chart C. line graph D. histogram
C. line graph
You have just constructed the chart displayed below.
The names of the hospital services are hard to read. the best way to deal with this problem would be to?
A. construct a line graph instead of a bar chart
B. use a column chart instead of a bar chart
C. plot your primary variable along the x-axis
D. divide the data into two charts.
B. use a column chart instead of a bar chart
The display below is a
A. bar chart, which is commonly used to display continuous data
B. bar chart, which is commonly used to display discrete data
C. histogram, which is commonly used to display continuous data
D. histogram, which is commonly used to display discrete data.
C. histogram, which is commonly used to display continuous data
The data display below is a
A. normal distribution or curve
B. positive skewed curve
C. negative skewed curve
D. heterogeneous curve.
A. normal distribution or curve
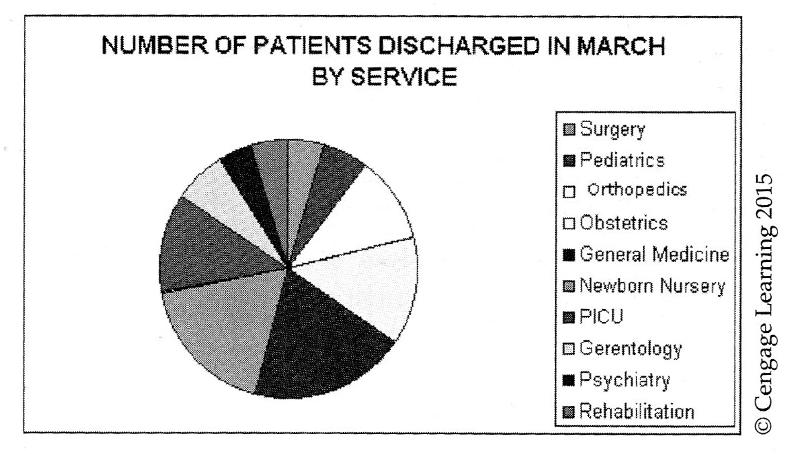
What conclusion can you make from the pie graph below?
A. A pie graph should not be used, because there are too many categories for effective display.
B. a pie graph should not be used, because the data are representational instead of quantitative
C. a pie graph should not be used, because the data are qualitative instead of quantitative.
D. a pie graph is a good choice and is often used to display this kind of data
A. A pie graph should not be used, because there are too many categories for effective display.
You are trying to improve communication with your staff by posting graphs of significant statistics on the employee bulletin board. You recently calculated the percentage of time employees spend on each of six major tasks. Because you would like the employees to appreciate each task as a percentage of their whole day, you will post these figures using a
A line graph B. bar graph C. scatter diagram D. pie graph
D. pie graph
The graph below can best be described as
A. sequential B. multimodal C. substitutional D. erratic
B. multimodal
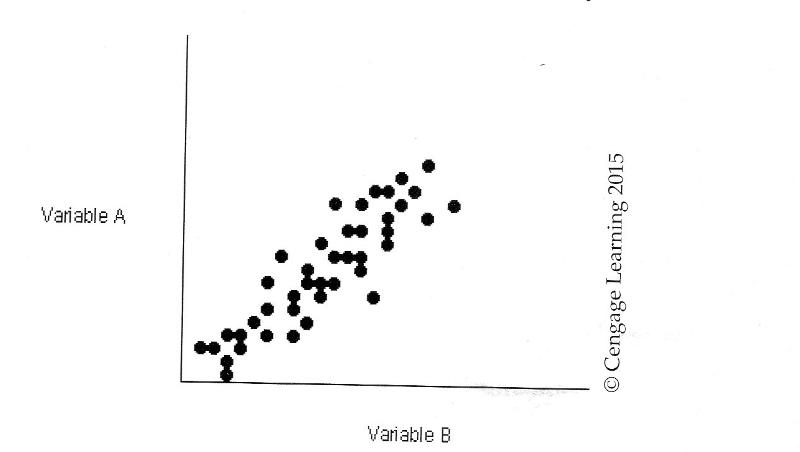
Looking at the data represented in the scatter diagram below, you would conclude that there is
A. no correlation between VariBLE A and Variable B
B. a positive correlation between variable A and Variable B.
c. a negative correlation between Variable A and Variable B.
D. a cause and effect relationship between Variable A and Variable B.
B. a positive correlation between variable A and Variable B.
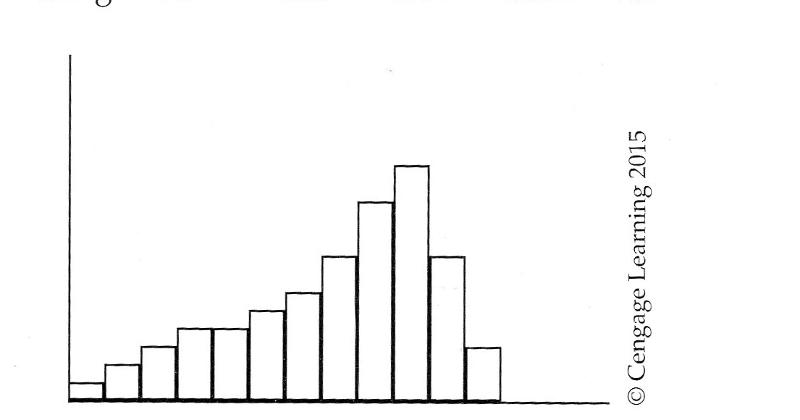
The data displayed in the histogram below could best be described as
A negatively skewed
B. positively skewed
C. evenly distributed
D. normally distributed.
A negatively skewed
You want to construct a data display for a frequency distribution. You will use a
A. frequency polygon or histogram
B. frequency polygon or bar chart
C. line graph or histogram
D. line graph or bar chart.
A. frequency polygon or histogram
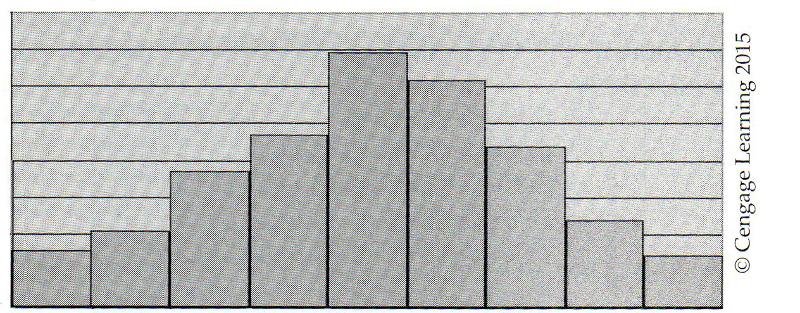
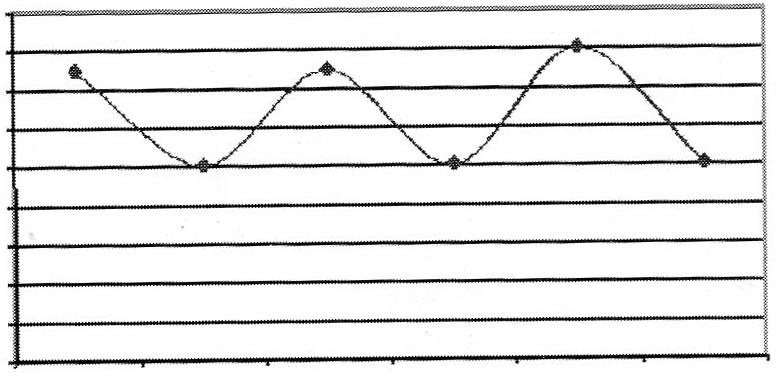
Look at the graph below. It is an example of a
A. stacked bar chart; it is well constructed
B. histogram; it is well constructed
C. comparison bar chart; it is not well constructed
D. frequency polygon;; it is not well constructed.
A. stacked bar chart; it is well constructed
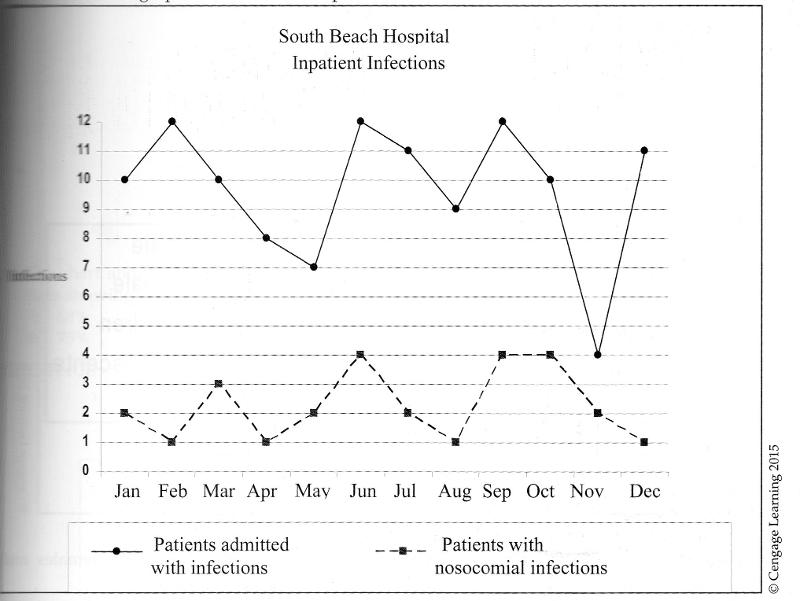
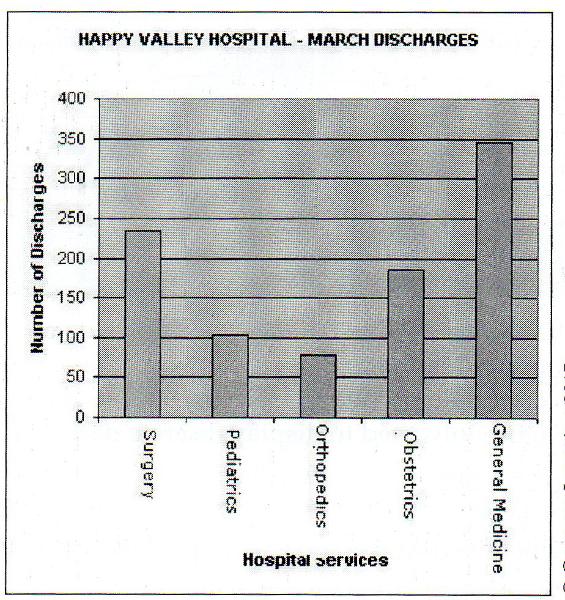
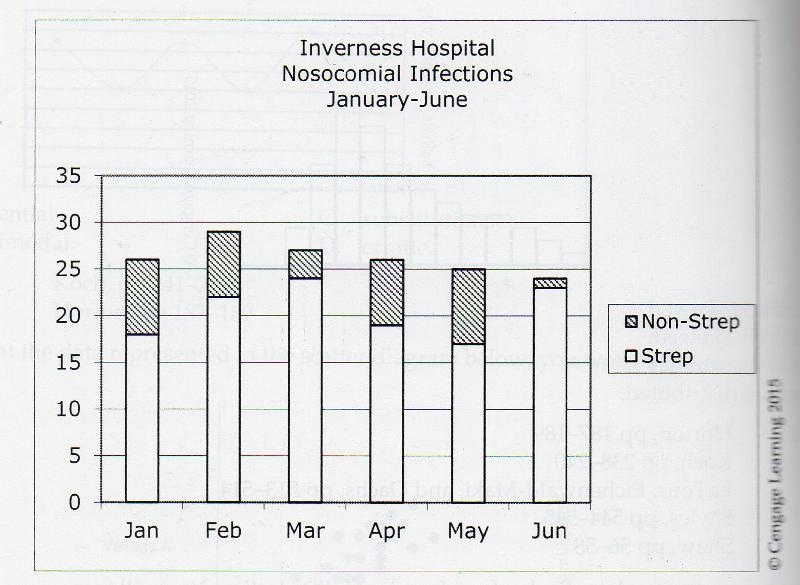
The total number of infections oat south beach hospital during the first quarter (jan-march) was
A. 6 B. 12 C. 22 D. 38
D. 38

Look again at the graph you used for the last question. From this graph, you can assume that more people.
A. were admitted to the facility with infections than without infections.
B. were admitted to the facility with infections than is typical for U.S. HOSPITALS.
C. were admitted to the facility with infections than acquired infections in the hospital
D. acquired infections in the hospital than were admitted with infections.
C. were admitted to the facility with infections than acquired infections in the hospital
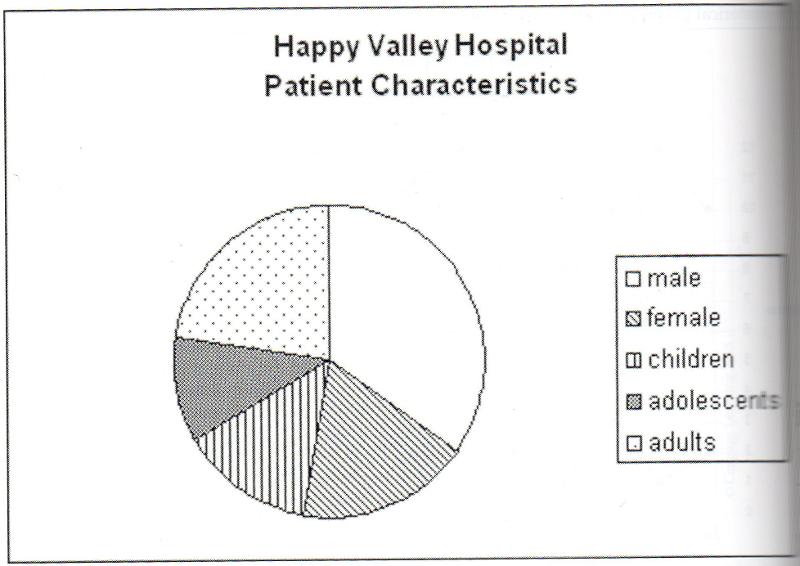
What is the biggest problem with the pie graph displayed above?
A. there is not enough variation in the patterns to clearly distinguish between females and children
B. the total males and females do not equal te total children, adolescents and adults
C. there are not definitions for children, adolescents and adults
D. there is more than one variable displayed on teh chart.
A. there is not enough variation in the patterns to clearly distinguish between females and children
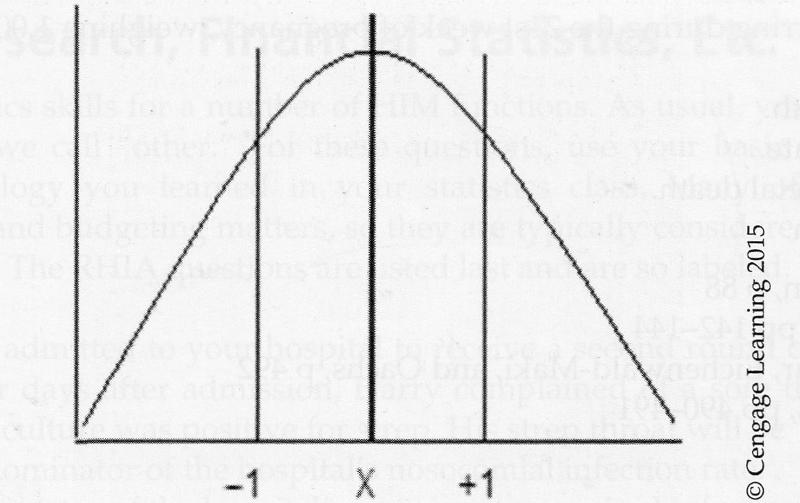
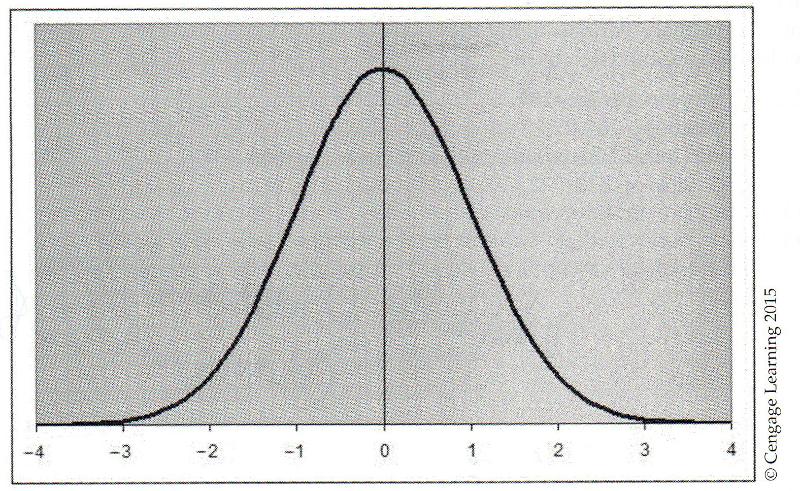
The chart above shows a normal distribution. What percentage of the cases fall within the two lines showing the standard distribution between -1 and +1 on either side of the mean?
A. 68% B. 75% C. 95% D. 99%
A. 68%
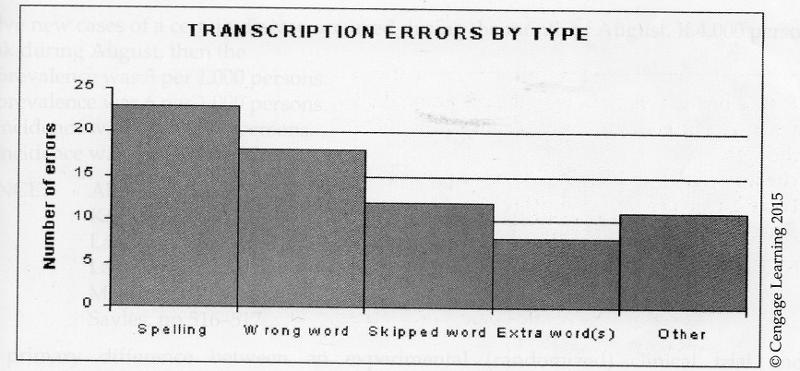
A transcription supervisor collected the data displayed above. What kind of data display is it? and how many errors are attributed to skipped words?
A. This is a Pareto diagram; twelve (12) errors were due to skipped words.
B. This is a bar chart; eighteen (18) errors were due to skipped words.
C. This is a Pareto diagram; eighteen (18) errors were due to skipped words.
D. This is a bar chart; twelve (12) errors were due to skipped words.
A. This is a Pareto diagram; twelve (12) errors were due to skipped words.
A fetal death orccurring during the 21st week of pregnancy, weighing 1,000g is considered to be a
A. early fetal death
B. preterm neonate
C. intermediate fetal death
D. late fetal death
D. late fetal death
EARLY FETAL DEATH less than 20 weeks gestation 500g or less
INTERMEDIATE FETAL DEATH 20 weeks completed gestation, but less than 28 weeks 501 to 1000g
LATE FETAL DEATH 28 weeks completed gestation Over 1,000g
The staff in the Human Resources Department is proposing a computer-based training program for 200 employees and need to prepare a budget for the time and cost of the training.
-The training program will be 30 mins in length
-there are 200 employees to be trained
-the rate of pay for 50 of the employees is $15.50 per hour
-the rate of pay for 50 employees is $12.00 per hour
-the rate of pay for the other 100 employees is $18.00
How many employee clock hours will be needed to complete the training?
A. 200 hours B. 150 hours C. 100 hours D. 50 hours
200 employees X 30 mins of training=6000/60=100 hours.
ans . 100 hours
-The training program will be 30 mins in length
-there are 200 employees to be trained
-the rate of pay for 50 of the employees is $15.50 per hour
-the rate of pay for 50 employees is $12.00 per hour
-the rate of pay for the other 100 employees is $18.00
How much should the training staff request in teh budget for doing the computer based training program?
A. $3,175.00 B $1,975.00 C. $1,887.50 D. $1,587.50
50 employees X $7.75 (half of $15.50 remember 30 min training)=387.50
50 employees X $6.00 (half of $12.00 remember 30 min training)=300.00
100 employees X 9.00 (half of $18.00 remember 30 min training)=900.00
387.50+ 300.00+ 900.00=$1587.50
ans $1587.50
-The training program will be 30 mins in length
-there are 200 employees to be trained
-the rate of pay for 50 of the employees is $15.50 per hour
-the rate of pay for 50 employees is $12.00 per hour
-the rate of pay for the other 100 employees is $18.00
What would be the average cost for training an individual employee?
A. $7.94 B. $9.00 C. $15.50 D. $15.87
total cost of training is
50 employees X $7.75 (half of $15.50 remember 30 min training)=387.50
50 employees X $6.00 (half of $12.00 remember 30 min training)=300.00
100 employees X 9.00 (half of $18.00 remember 30 min training)=900.00
387.50+ 300.00+ 900.00=$1587.50
1587.50/200 employees=$7.9375
ans. $7.94
At Great Plains Regional Hospital, record processing takes approximately 18 minutes. If there are 15,620 discharges for the month, how many personnel hours are needed for this volume of work?
A. 2,891 B. 4,686 C. 5,496 D. 3,394
15,620*18mins=281160/60 mins per hour=4686
ans . 4686
Mallory, the coding supervisor, must determine the number of full time employees (FTEs) needed to code 600 discharges per week. It takes an average of 20 minutes to code each record and each coder will work 40 hours per week. How many coders are needed?
A. 6.0 B. 5.0 C. 12.00 D. 4.5
600 codes per week X 20 mins= 12000
40 hours per week x 60 mins per hour = 2400
12000/2400=5 coders are needed.
Gregg is a recent graduate who has applied for a Trauma Registry position at a Chicago hospital while he prepares to apply to graduate school. In making the decision, he considers the offer of $15 per hour for a 40 hour week, benefits of 27.5% of his salary, and tuition waivers of six credits per year at $145. He calculated that his total compensation, rounded to the nearest dollar, would be.
A. $40,650 B. $39,563 C. $38,599 D. $31,030
40 hours X $15.00=600X52 weeks in a year=31200
31200*.275 benefits=8580
6 credits per year X $145=870
31200+8580+870=40650
ans. $40,650
The RHIT supervisor for the filing and retrieval section of Community Clinic is developing a staffing scheduling for the year. The clinic is open 260 days per year and has an average of 600 clinic visits per day. The standard for filing records is 60 records per hour. The standard for retrieval of records is 40 records per hour. Given these standards, how many filing hours will be required daily to retrieve and file records for each clinic day?
A. 6 hours per day
B. 10 hours per day
C. 15 hours per day
D. 25 hours per day
600 visit per day/60=10
600 visit per day/40=15
10+ 15= 25 hours per day.
Community Hospital had 25 inpatient deaths, including newborns, for the month of June. The hospital performed five autopsies for the same period. What was the gross autopsy rate for the hospital for june?
A. 002% B. 5% C. 20% D. 200%
5/25= 0.2*100= 20%
ans 20%
Community Memorial Hospital had 25 inpatient deaths, including newborns, during the month of June. The hospital had a total of 500 discharges for the same period, including deaths of adults children, and newborns. The hospital's gross death rate for the month of june was:
A. 0.05% B. 2% C. 5% D. 20%
25/500= 0.05*100= 5%
The acute-care hospital discharges an average of 55 patients per day. The HIM department is open during normal business hours only. The volume productivity standard is six records per hour when coding 4.5 hours per day. Assuming that standards are met, how many FTE coders does the facility need to have on staff in order to ensure that there is no backlog?
A. 2.85 B. 5 C. 14.26 D. 27
55*7 per week = 385 per week to code
6*4.5= 27 X 5 days =135 cod per week
385/135=2.85
a 335 bed hospital opened a new wing on June 1 of a nonleap year, increasing its bed count to 350 beds. The total bed count days for the year at the hospital was
A. 125,485
B. 122,275
C. 127,750
D. The answer cannot be calculated with the information provided.
335 x 151 + 350 X 214 =125,485
jan31 + feb28+ Mar31 + Apri30 + May31= 151
Jun30 + Jul31 + Aug31+ Sept 30 + Oct 31 + Nov 30 + dec31=214
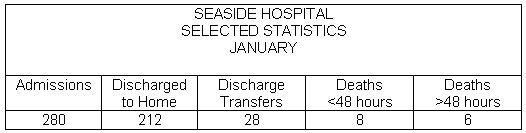
Based on the information below, what was the net death rate at Seaside Hospital in January?
- 5.8%
- 2.4%
- 2.8%
- 3.8%
>48 6/212 + 28 +6= 2.4%

Use the information provided in the table above to calculate the delinquent rate. The delinquent rate
- is 36%.
- is 71%.
- cannot be determined.
- is 50%.
Calculation: (304 × 100) / 845 = 36%
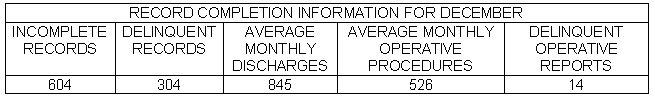
The percentage of records delinquent due to the absence of an operative report
- is 1.7%.
- is 4.6%.
- is 2.7%.
- cannot be determined from the information given.
Calculation: (14 × 100) / 526 = 2.66% or 2.7%
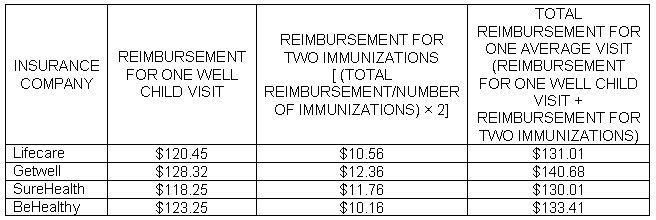
Most of the children who are seen at MMBC will have a well child visit and two immunizations. If you add the reimbursement for two immunizations to the reimbursement for each well child visit, which insurance company benefits MMBC most?
- Getwell
- BeHealthy
- SureHealth
- Lifecare
CALCULATIONS:
Reimbursement for one well child visit = total
reimbursement divided by number of visits.
Reimbursements for two
immunizations = total reimbursement divided by number of immunizations
x 2.
Total reimbursement for one average visit = reimbursement
for one well child visit + reimbursement for two immunizations.
The file clerks in your department's main file area report that they are able to locate 400 out of 450 requested records during the past month. There are a total of 4,500 records in the main file. What is the area's accuracy rate?
- 1.1%
- 8.9%
- 10.0%
- 88.9%
Calculation: (400 × 100) / 450 = 88.9%
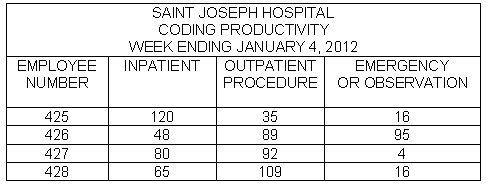
The performance standard for coders is 28–33 workload units per day.
Workload units are calculated as follows:
Inpatient record = 1
workload unit
Outpatient surgical procedure records = 0.75
workload units
Outpatient observation/emergency records = 0.50
workload units
One week's productivity information is
shown in the table above. What percentage of the coders is meeting
the productivity standards?
- 100%
- 25%
- 50%
- 75%
employee # 425: 120 + (35 × 0.75) + (16 × 0.5) = 154.25
154.25/5
= 30.85 average work units per day
employee # 426: 48 +
(89 × 0.75) + (95 × 0.5) = 162.25
162.25/5 = 32.45 average work
units per day
employee # 427: 80 + (92 × 0.75) + (4 ×
0.5) = 151
151/5 = 30.2 average work units per day
employee # 428: 65 + (109 × 0.75) + (16 × 0.5) =
154.75
154.75 = 30.95 average work units per day
A patient who was admitted to the hospital on January 14 and discharged on March 2 in a nonleap year has a length of stay of
- 48 days.
- 45 days.
- 47 days.
- 46 days.
Calculation: 31 - 14 + 28 + 2 = 47 days
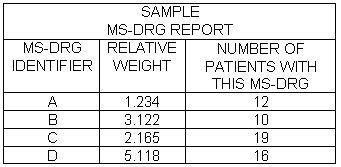
Based on the MS-DRG report above, what is the case-mix index for this facility?
- 57
- 0.204193
- 2.965807
- 11.639
Calculation: 169.051 total relative weight / 57 total patients seen = 2.965807
Now that the EHR has been fully implemented, you are ready to move old records to basement storage. You are ordering shelving for those old paper files. You have 18,000 records. The files average is three files per filing inch. The shelf units you have selected have six shelves that will hold 34 inches per shelf. You will have to plan for a 20% expansion rate to accommodate miscellaneous paper records over the next 10 years. How many shelving units should you order?
- 35
- 31
- 30
- 36
Calculation: (You can only purchase whole shelf units.)
34 × 3
= 102 records per shelf
102 × 6 = 612 records per filing
unit
18,000 × 0.20 = 3,600 records for projected expansion
18,000 + 3,600 = 21,600 total records
21,600/612 = 35.29 =
36 total filing units needed
Annual costs for the only Release of Information Clerk at Jacksonville Beach Healthcare Center (salary and benefits) are $36,429. The monthly cost for the copier used solely for ROI is $89 (supplies and repairs). It costs the department $0.95 on average for ROI mailings (envelopes and postage). There were 687 requests filled for ROI last month. The cost per request for release of information last month was
- $4.42.
- $4.63.
- $4.55.
- $5.50.
Calculations:
• $36,429 annual labor costs / 12 = $3,035.75 cost
per month
• $3,035.75 + $89 copier cost = $3,124.75 monthly
costs/687
• ROI last month = 4.548 or $4.55 unit cost (not
counting mailing)
• $4.55 + 0.95 average mailing cost = $5.50
per ROI
The coder works 7.5 hours per day. If a time standard is determined from sample observations to be 2.50 minutes per record for coding emergency room records, what is the daily standard for the number of records coded when a 15% fatigue factor is allowed?
- 153 records per day
- 200 records per day
- 192 records per day
- 180 records per day
Calculation: 7.5 hours × 60 minutes per hour = 450 minutes per
day
450 × 15% = 67.5
450 – 67.5 = 382.5
382.5/2.5 = 153
During the work sampling of a file clerk's activity, it is noted that the employee is speaking on the telephone during 76 of 300 observations. How much of the employee's time is spent on the phone if the employee works 7 hours a day?
- 3.28%
- 9.2%
- 3.94 hours
- 1.77 hours
Calculation: 76/300 = 0.253
0.253 × 7 hours = 1.77 hours
Community Hospital Administration decided to change the number of adult and children beds from 300 to 375 effective July 1. The total number of inpatient service days for adults and children for the year was 111,963. What was the percentage of occupancy rate for adults and children for the entire year?
- 45.4%
- 90.8%
- 0.9%
- 91.0%
Calculation:
\frac{(111,963 x 100)}{(300 x 181) + (375 x 184)}= 90.8%
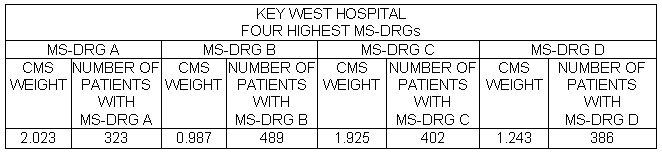
Key West Hospital collected the data displayed above concerning its four highest volume MS-DRGs. Which MS-DRG generated the most revenue for the hospital?
- MS-DRG C
- MS-DRG D
- MS-DRG A
- MS-DRG B
Calculations:
MS-DRG A: 2.023 × 323 = 653.43
MS-DRG B:
0.987 × 489 = 485.65
MS-DRG C: 1.925 × 402 = 773.85
MS-DRG
D: 1.243 × 386 = 479.80REFERENCE:
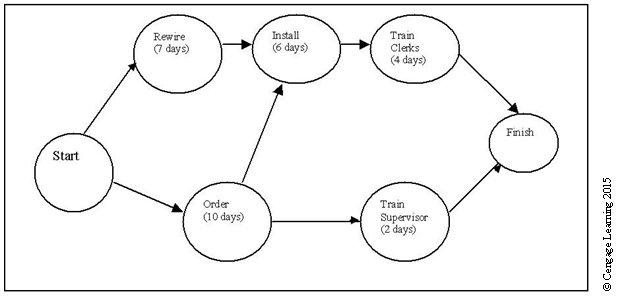
How long will it take to complete the project described below?
- 20 days
- 17 days
- 12 days
- 29 days
20 DAYS
When checking the census data at South Beach Women's Center, you see that just yesterday, there were four sets of triplets, five sets of twins, and eight single births. Yesterday, South Beach Women's Center had
- 30 deliveries.
- 25 deliveries.
- 17 deliveries.
- 39 deliveries.
17 DELIVERIES
The MS-DRG weight in a particular case is 2.0671 and the hospital's payment rate is $3,027. How much would the hospital receive as reimbursement in this case?
- $6,257.11
- $3,027.00
- $5,094.10
- $960.00
Calculation: $3,027 × 2.0671 = $6,257.11
Johnston City was set upon by a swarm of killer bees. All 5,000 residents are at risk of a bee attack. If 25 residents were attacked by the bees, the incidence of bee attacks
- is 5 in 5,000.
- is 5 in 1,000.
- cannot be determined at this time.
- is 25 in 1,000.
- is 5 in 1,000.
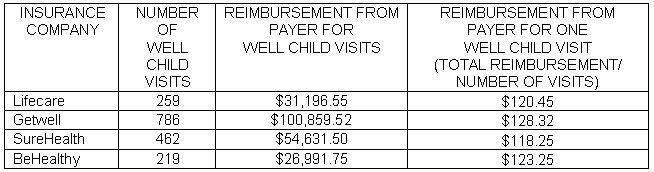
- MMBC receives the best reimbursement for well child visits
from
BeHealthy. - Getwell.
- Lifecare.
- SureHealth.
Getwell.
An HIM Department Budget Report for May shows a payroll budget of $25,000 and an actual payroll expense of $22,345. The percentage of budget variance for the month is
- 0.9%.
- $2,655.
- 11%.
- $265.
Calculation: $2,655 × 100 divided by $25,000 = 10.6 = 11%
An HIM Department Budget Report for May shows a payroll budget of $25,000 and an actual payroll expense of $22,345. The percentage of budget variance for the month is
- 0.9%.
- $2,655.
- 11%.
- $265.
Calculation: $2,655 × 100 divided by $25,000 = 10.6 = 11%
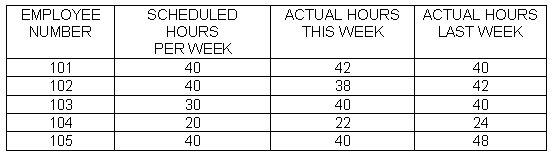
Your hospital takes advantage of the 8/80 exemption for health care facilities. Assuming that no employee worked more than 8 hours in a day, which of the employees listed in the table below will be paid overtime this pay period?
- Employees 101, 102, and 105
- Employees 101 and 105
- Employees 101, 104, and 105
- Employees 101, 103, 104, and 105
Although employees 103 and 104 worked more hours than scheduled, they still did not work overtime using the 8/80 rules.
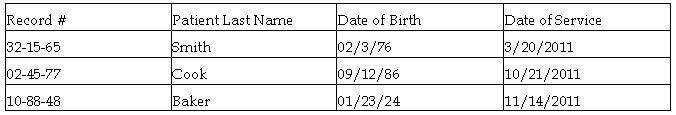
Which of the following is the unique identifier in the database illustrated in the table above?
- date of service
- patient's last name
- date of birth
- record number
RECORD NUMBER
The formula used to calculate the percentage of ambulatory care visits made with same day appointments is
-
number of patients seen
with same day appointments for a period x 100
number of patients seen in the same period -
number of patients seen
with advance appointments for a period x 100
number of patients seen in the same period -
number of patients seen
with advance appointments for a period x 100
number of patients seen with same day appointments for the same period -
number of patients seen
with same day appointments for a period x 100
number of patients seen with advance appointments for the same period
-
number of
patients seen with same day appointments for a period x
100
number of patients seen in the same period
The correspondence section of your department receives an average of 50 requests per day for release of information. It takes an average of 30 minutes to fulfill each request. Using 6.5 productive hours per day as your standard, calculate the staffing needs for the correspondence section.
- 3.8 FTE
- 3 FTE
- 4 FTE
- 2.5 FTE
Calculation: 50 × 30 = 1,500
1,500/60 = 25
25/6.5 = 3.8
The census taken at midnight on August 1 showed 99 patients remaining in the hospital. On August 2, four patients were admitted, there was one fetal death, one DOA, and seven patients were discharged. One of these patients was admitted in the morning and remained only 8 hours. How many inpatient service days were rendered on August 2?
- 96
- 97
- 94
- 95
Calculation:
Remaining at midnight 8/1 99
Admissions+4
Discharges–7
In and Out Same Day+1
Inpatient Service Days 8/2 97