Shift factors
- Technology
- Availability of resources
Other
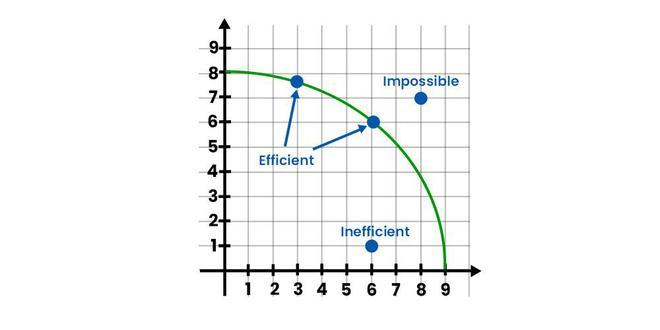
- Straight line: Constant opportunity cost
- Bowed out: Increasing opportunity cost
PPC
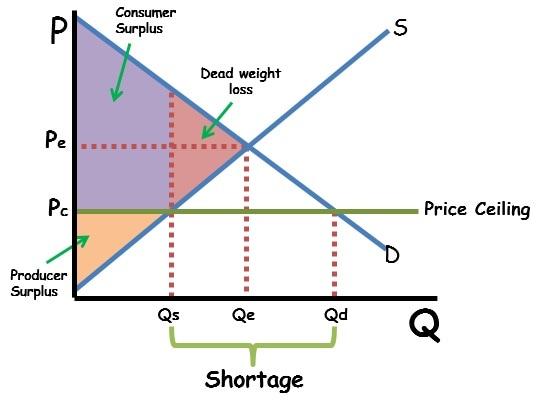
- binding must be below equilibrium
- quantity demanded is greater than quantity supplied
- creates a shortage
- example rent control
Price cealing
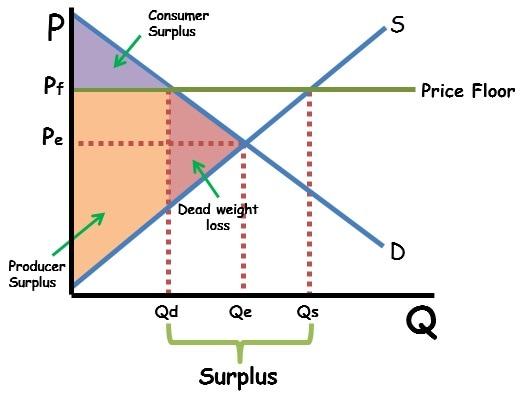
- binding must be above equilibrium
- quantity supplied is greater than quantity demanded
- create a surplus
- example a minimum wage
Price floor
- queens over princesses
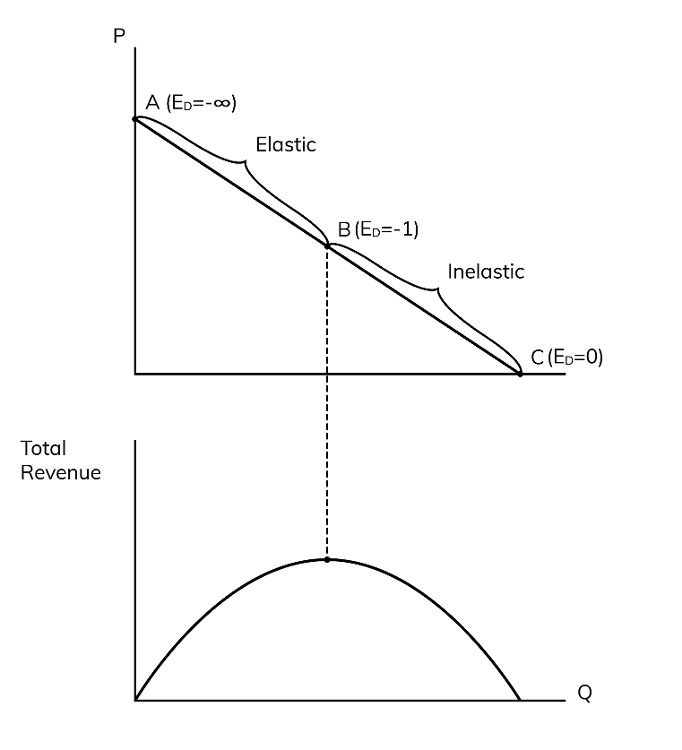
elasticity along a demand curve
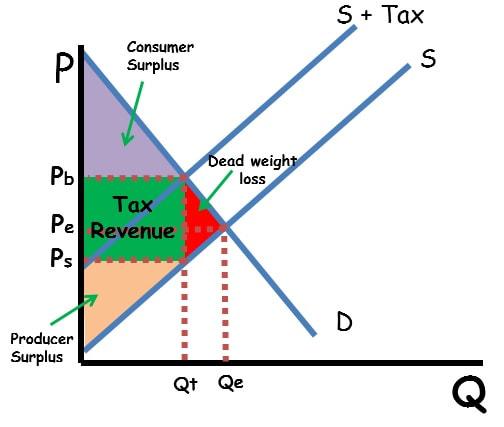
- less elastic curve pays more tax
- perfectly in elastic puts tax all on producers
- perfectly elastic puts tax all on consumers
Supply and demand with Tax, CS, and PS
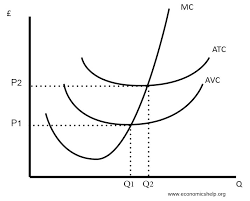
- will keep producing until price falls below avc
- area between avc and atc is the amount of fixed cost
- change in fixed cost moves atc only
- change in variable cost moves atc, avc, and mc
Cost curves
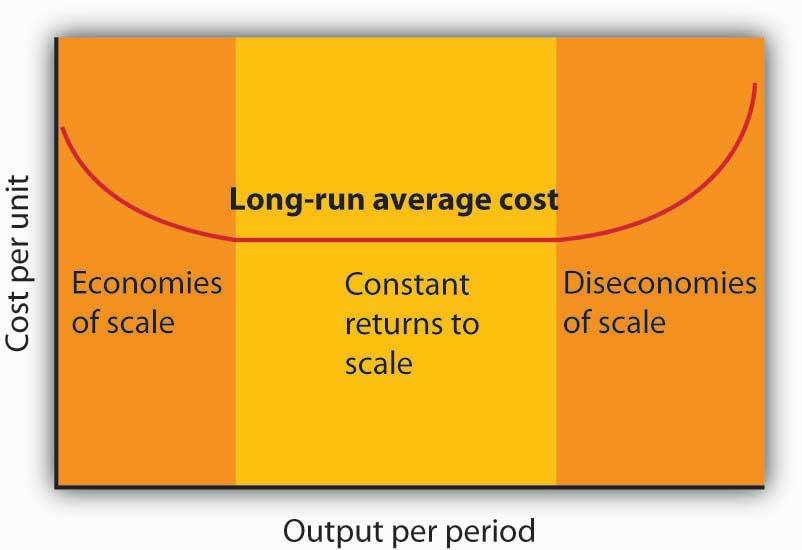
- economies of scale, constant returns to scale, diseconomies of scale
- monop comp in the long run is producing in economies of scale
LRATC

- price taker
- product is identical and has perfect substitutes
- when profit is made in the short run firms enter (no barriers to entry)
- zero economic profit in the long run
- both productively efficient and socially optimal in the long run
Perfect competition
- high barriers to entry
- unique product
- price maker
- produces in the elastic region of the graph
- not productively efficient or socially optimal
monopoly
- d and mr are the same
- there is no CS or DWL
price discriminating monopolist
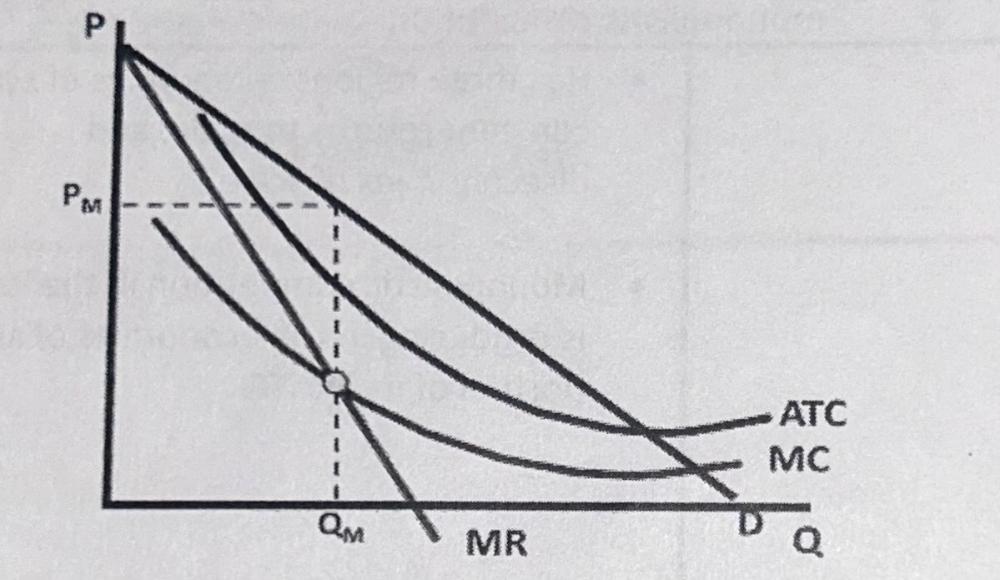
- when demand intersects atc while demand is downward sloping
- government can regulate (at socially optimal quantity with a price cealing)
- firm would need a lump sum subsidy (atc would be greater than price)
natural monopoly
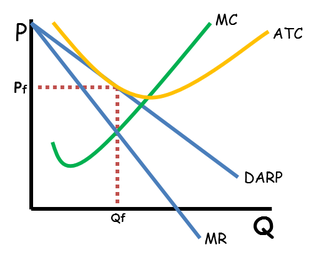
- atc touches but does not cross darp line
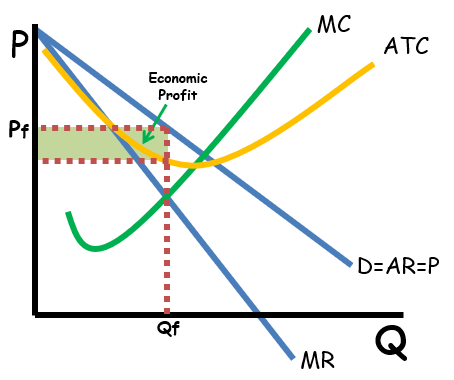
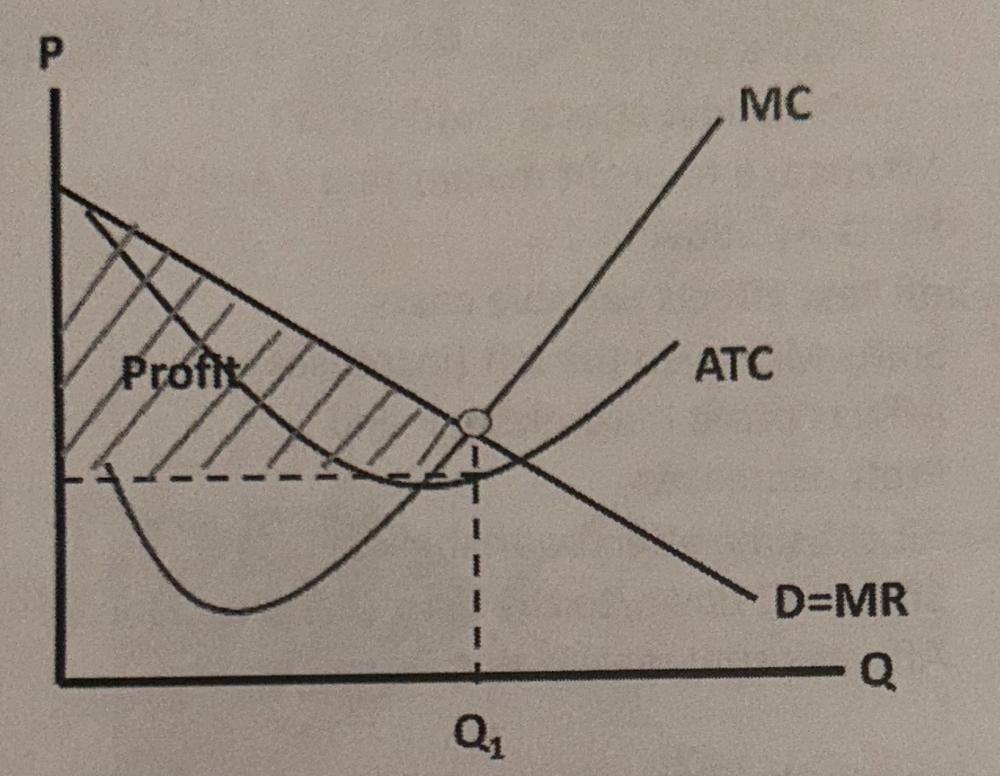
monopolistic competition in long run equilibrium
- differentiated product
- some control over price
- when profit is being made firms will enter (no barriers to entry)
- demand for the firms product increases when firms leave the market and decreases when firms enter
- zero economic profit in the long run
- LRATC tangent at Q1 in long run
- not productively efficient or socially optimal
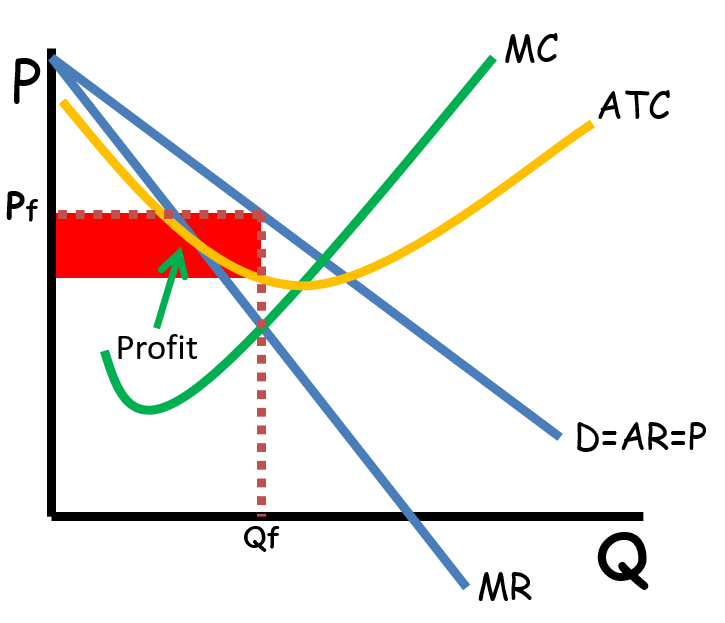
monopolistic competition in short run profit
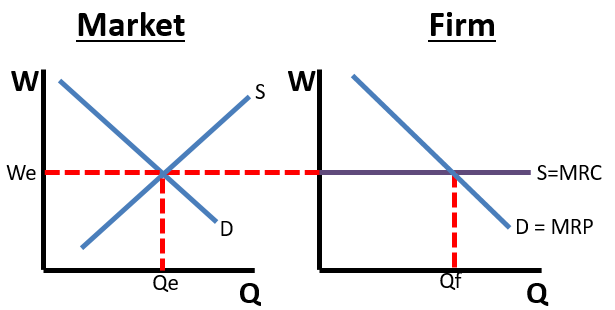
- firms are wage takers
- sometimes just a shift in mrp
- hire where mrp= mfc
- min wage results in less workers hired
perfectly competitive labor market
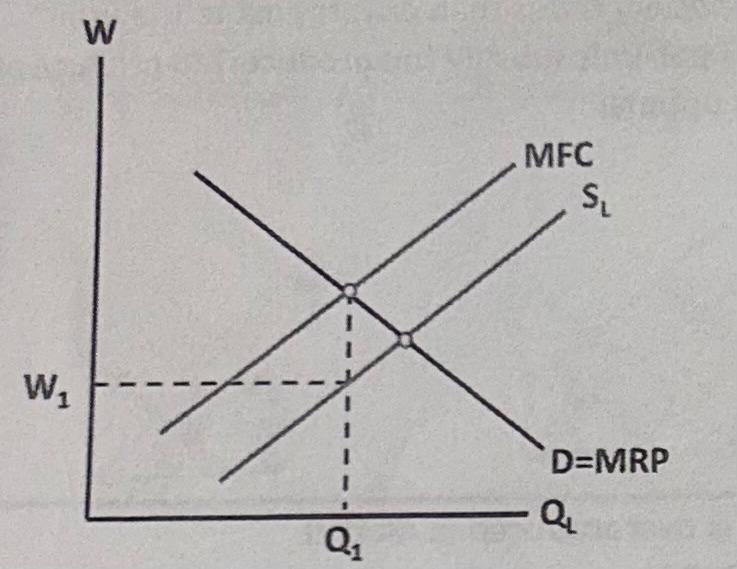
- wage maker
- mfc curve is above the supply curve
- mfc doesn’t equal wage
- firm will hire additional labor as long as mrp is greater than mfc
- hires fewer workers than a perfectly competitive labor market
monopsony
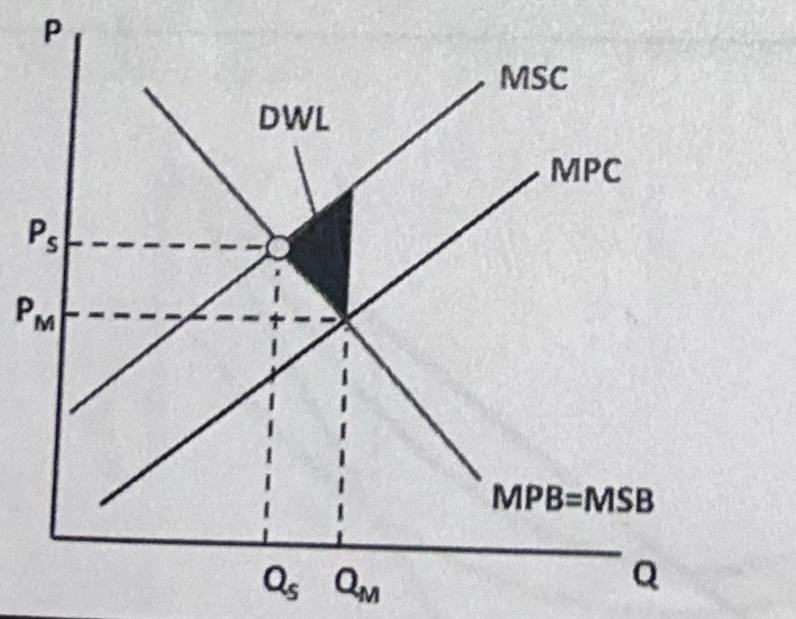
- good is overproduced in the market
- msc> mpc
- cost to society is higher than the individual firm
- needs a per unit tax on producer to be socially optimal
negative production
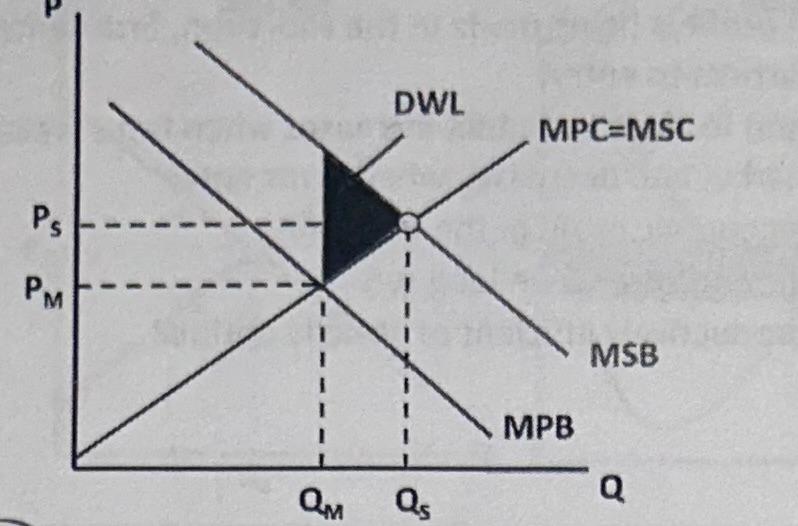
- good is underproduced in the market
- msb>mpb
- benifit to society is higher than the benefit for the individual firm
- needs a per unit subsidy on consumer to be socially optimal
positive consumption
4 dots
- profit maximizing mc=mr
- socially optimal mc=d
- fair return atc=d
- revenue maximizing point where mr crosses q axis
elasticity
queens/ princesses
price elasticity of demand ed>1
%change in quantity demanded/%change in price
cross price elasticity of demand
% change in demand/ % change in p of related good
substitutes
e cross price > 0 positive number
complements
e cross price < 0 negative number
income elasticity of demand
% change in demand/ % change in income
normal goods
e income > 0 ppl will spend more on these when their income rises
inferior goods
e income < 0 ppl will spend less on these when income rises
Total revenue
p x q
price elasticity of supply es>1
%change in quantity supplied/ %change in price
utility maximizing rule
MUx/Px = MUy/Py
Fixed costs
constant, exists at zero output
Variable costs
change as output changes
Total costs
Fixed costs+ variable costs
Marginal cost
Change in TC (change in TC/ change in Q)
MPP
change in total product/ change in quantity of labor
MRP
Output x MPP
hire where mrp is greater than or equal to mfc