WHy patients seek or not healthcare?
- pain
- symptoms
- concerns/fear
- cost
- acess/ease of use
- previous experience with healthcare
- to be heard/cared for
Patient perception
- Perceived susceptibility
- Perceived benefit to taking
action vs. Perceived barriers to taking
action - Perceived seriousness
Perception of threat
- Physical harm?
- Pain?
- Disability?
- identity
Outcome measures types
- Self-report measures
- Performance-based measures
- Observer-reported measures => parent or caregiver
- Clinician-reported measures =>HCP fills out
Outcome measures types: Self-report
- often called patient-reported outcomes, PROs
- Typically questionnaires
- Can be disease-specific or generic
- Disease, example: the Knee Outcome Survey (KOS)
- Generic: Lower Extremity Functional Scale [kind of] (LEFs), QoL scales, GROC, SF-12
- Goal: patient beliefs, social factors, health factors
Outcome measures types: Performance
- Objective measurements (scores) or qualitative (quality of a movement)
- Goal: physiologic factors
Levels of measurements: 2 categories
qualitative & quantitative
Levels of measurements: 4 types
- Nominal
- Ordinal
- Interval
- Ratio
Psychometrics
intrinsic components of a test that reveal
information about a
test's adequacy, relevance, and usefulness
Psychometrics: Validity
they measure what they are intended to measure
Psychometrics: Reliability
they are stable over time (repeatable)
Psychometrics: Responsiveness
they can detect changes over time
• LR = 1
no change in probability, the test is useless
LR = 2
• LR = 5
• LR = 10
- ~15% increase in probability = small amount
- ~30% = moderate amount
- ~45% = pretty high!
LR = .5
• LR = .2
• LR = .1
- ~15% decrease
- ~30% decrease
- ~45% decrease
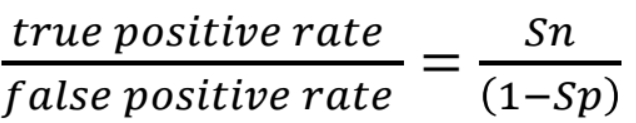
+LR
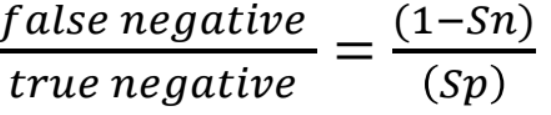
-LR
Positive Predictive Value (PPV)
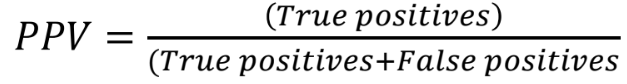
• The proportion of those with a positive test that have the disease
Negative Predictive Value (NPV)
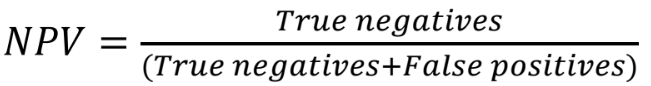
The proportion of those with a negative test that do not have the disease
Sensitivity:
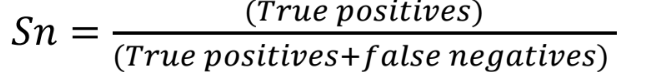
Proportion of people with a disease that have a positive test
Specificity
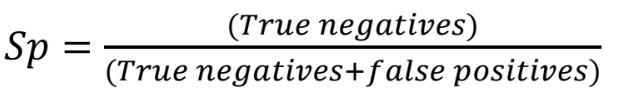
Proportion of people without a disease that have a negative test
Validity
- The ability of the tool to measure what it is intended to measure
- It implies that a tool must be relatively free from error (i.e. reliable)
Reliability
- The extent to which a measurement is consistent and free from
error
- i.e. reproducibility or dependability of a measurement
Construct Validity
- The degree to which the scores of a tool are consistent with
hypotheses based on the abstract concept (does it measure the theoretical component of the construct or variable?)
Discriminant Validity—Tests the hypothesis that the tool is not improperly
- Tests the hypothesis that the tool is not improperly
Cross-Cultural
- The degree to which a culturally adapted tool is equivalent to
Types of Validity
- Content Validity
- Construct Validity
- Discriminant Validity
- Criterion (-based) Validity
- Concurrent Validity
- Predictive Validity
- Cross-Cultural