Given the equation mgh - 1/2 mv 2, rearrange the equation to solve for v.
v = sqrt(2gh)
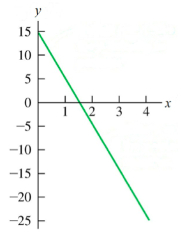
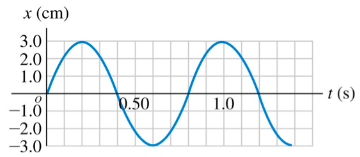
What is the y-intercept of the line shown in this graph?
15
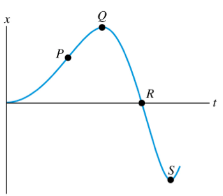
On the graph, determine the point(s) where the function has a zero slope.
Point Q and Point S
Given the equation y = mx + b, rearrange the equation to solve for m.
m = (y–b)/x
Given the equation PV = nRT, rearrange the equation to solve for T.
PV = nRT
Divide boh sides by nR to isolate T
T = PV/nR
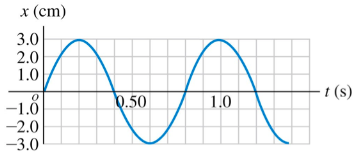
Which equation best describes the sinusoidal function represented in this graph?
x = 3.0sin((2n/0.8)(t))
Given the equation cos(theta) = x/r, rearrange the equation to solve for x.
x = rcos(theta)
Given the equation xtan(theta) = y, rearrange the equation to solve for .
theta = arctan(y/x)
Given the equation q = Q0e^(t/RC), rearrange the equation to solve for t.
t = -RCln(q/Q0)
How much is 15% of 50?
7.5
Given the equation 1/a + 1/b = 1/c, rearrange the equation to solve for c.
c = (ab) / (b+a)
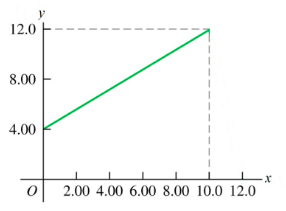
What is the slope of the line shown in this graph?
0.800
What is 12.5% of 20?
2.5
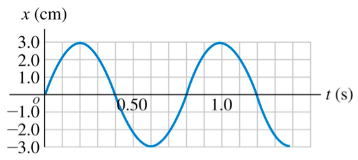
What is the period of the sinusoidal function represented in this graph?
0.8 s
Which of the following equations correctly describes the green line shown in this graph?
y = -10x + 15
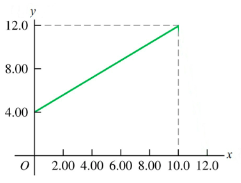
Which of the following equations correctly describes the green line shown in this graph?
y = 0.800x + 4.00
What is the amplitude of the sinusoidal function represented in this graph?
3.0 cm
If you have $50 and that money is reduced by 20%, how much money do you have after the reduction?
$40
Given the equation y = mx + b, rearrange the equation to solve for b.
b = y – mx
On the graph, determine the point(s) where the function has a negative slope.
Point R
What is the slope of the line shown in this graph?
-10
What is the y-intercept of the line shown in this graph?
4.00
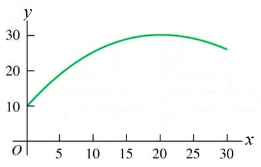
Which of the following equations correctly describes the green function shown in this graph?
y = 10 + 2x - 0.05x2
How much is 0.25% of 60?
0.15
Which flashcards helped me?
https://quizlet.com/511204166/dsm-module-2-flash-cards/