
A complex trait is a trait that is influenced by ______.
several genes and the environment
A trait that can be described numerically, such as height or weight, is defined as a(n) ______ trait.
quantitative
Which field of genetics studies the inheritance of complex traits?
Quantitative genetics
The length of an ear of corn is an example of a(n) _____ trait.
quantitative
A trait that does not fall into discrete categories are called ____.
continuous
e.g. height and weight
A meristic trait is a trait that ______.
can be counted and expressed in whole numbers
A quantitative trait is defined as a trait that ______.
can be described numerically
A trait that is influenced by many genes and is inherited quantitatively is defined as a(n) ______ trait.
threshold
A frequency distribution is a graph that shows the ______.
number of individuals in various phenotypic categories
Which of the following are examples of quantitative traits?
Speed of flight in birds
Blood pressure in humans
Number of bristles in Drosophila
A continuous trait is a trait that ______.
does not fall into discrete categories
A frequency distribution in which a trait varies in a symmetrical way around an average value is called a(n) ____ distribution and produces a(n) ____ -shaped curve.
normal; bell
A trait that can be counted and expressed in whole numbers is called a(n) ______ trait.
meristic
Which field of genetics involves the statistical study of biological traits?
Biometrics
What is a threshold trait?
A trait inherited quantitatively due to contributions of many genes
In a group of ten dairy cows, the following amounts of milk production per day were observed (measured in liters per day): 15, 16, 18, 18, 20, 20, 20, 21, 21, 22. What is the mean milk production per day in this group of cows?
19.1 liters per day
A graph that presents phenotypic categories on the x-axis and the number of individuals that fall into a category on the y-axis is called a(n) ____ distribution.
frequency
Which of the following formulas is the correct equation for calculation of the mean? In these equations, X� is the mean, ΣX is the sum of all values in the group, and N is the number of individuals in the group.
Multiple choice question.
X� = X with a line over it.
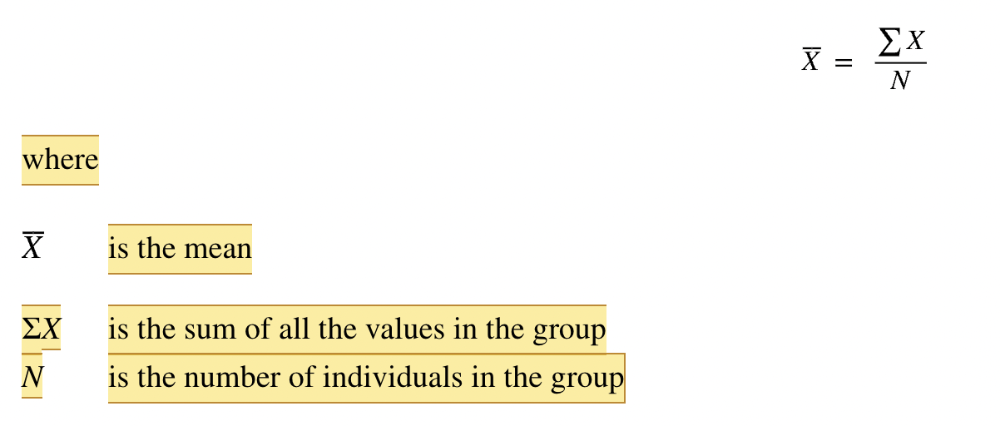
X�= ΣXN
Reason:
The sum of all of the values of a parameter within a group divided by the number of individuals in the group is defined as the mean.
The length of an ear of corn is an example of a(n) _____ trait.
quantitative
In a sample with N individuals, variance is calculated as the _____.
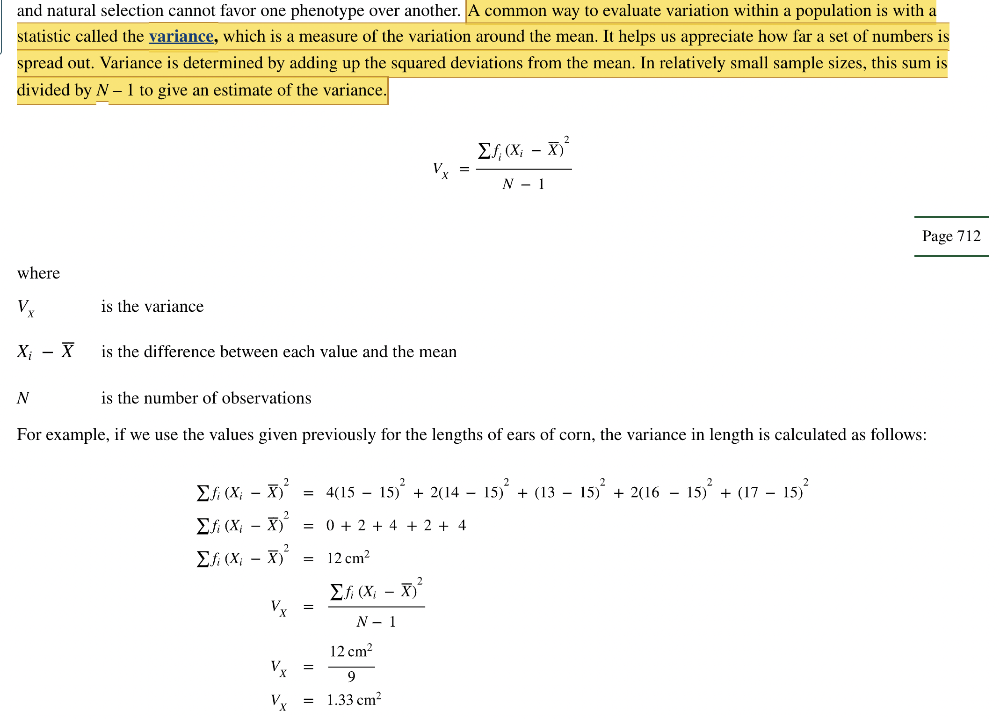
sum of the squared deviations from the mean divided by N - 1
What is a normal distribution?
A frequency distribution that varies in a symmetrical way around an average value
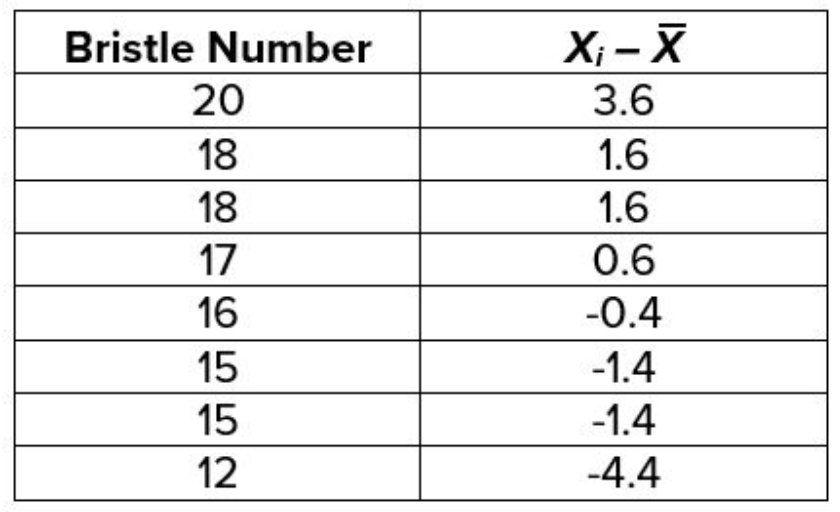
In a group of fruit flies, the mean number of abdominal bristles was 16.4 bristles. The data are presented in the table. What is the variance of bristle number in this group of fruit flies?
6.0 bristles2
What is the focus of the biometric field of genetics?
The statistical study of biological traits
In a sample of corn growing in a field, the mean percentage of oil content is 12.0%. The variance of oil content is 4.0%2. 100 ears of corn were analyzed to determine these values. What is the standard deviation of oil content for this sample of corn?
2.0%
Reason:
Take the square root of the variance. 4√ = 2
In a group of eight fruit flies, individuals with the following numbers of abdominal bristles were observed: 10, 10, 11, 8, 11, 12, 10, 11. What is the mean number of abdominal bristles in this group of fruit flies?
10.4 bristles
The square root of the variance is equal to the ____ ____ of a data set.
standard deviation (SD)
The sum of all of the values of a parameter within a group divided by the number of individuals in the group is defined as the ______.
mean
In a normal distribution, what percentage of all individuals have phenotypic values within one standard deviation of the mean?
68%
Variance is a statistical measure of the ______.
variation of a trait around the mean
True or false: When a chi-square test shows that the correlation coefficient for two variables is statistically significant, it means that there is a cause-and-effect relationship between the variables.
False
Reason:
A significant correlation coefficient does not necessarily imply a cause-and-effect relationship. It simply shows that there is a true association between the two variables.
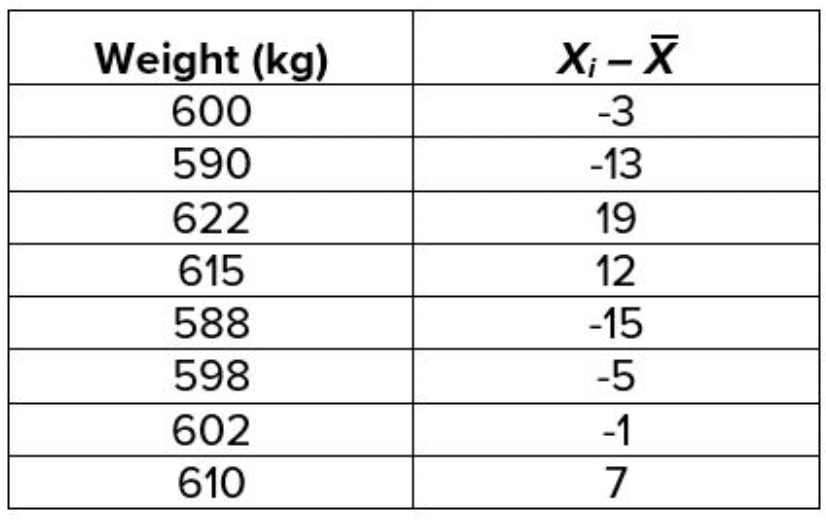
A farmer measured the weight of eight newborn cattle. The data are presented in the table provided. The mean weight of the cattle in this group is 603 kg. What is the variance?
140 kg2
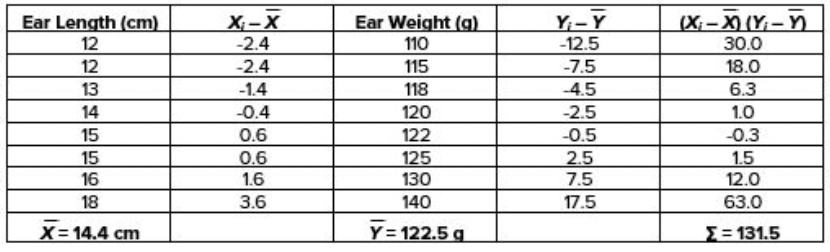
The following data were collected from a sample of corn ears. The length and weight of each ear were measured. What is the covariance of ear length and ear weight?
18.8
In a bushel of corn, the mean length of the corn ears is 16.0 cm. The variance of the ear length in this bushel of corn is 2.0 cm2. In this bushel, 20 ears of corn were measured to determine these values. What is the standard deviation of ear length in this sample?
1.4 cm
Reason:
SD = Vx√ = 2.0√ = 1.4 cm
The standard deviation of a data set is equal to the square root of the ______.
variance
Covariance is a measure of the relationship between ______.
two different variables
If a population fits a normal distribution, then what percentage of individuals have phenotypic values within two standard deviations above or below the mean?
95%
For a population of mice, the mean weight is 25.0 grams, and the standard deviation of weight is 0.3 grams. The mean length from the nose to the base of the tail is 8.0 cm, and the standard deviation of body length is 0.4 cm. The covariance of these two variables is 0.07. What is the correlation coefficient between these two variables?
0.58
Reason:
(0.07) / (0.3)(0.4) = 0.58
If a correlation coefficient is found to be statistically significant, it means that ______.
there is a true association between the two variables
Reason:
A strong correlation does not necessarily imply a cause and effect relationship.
Reason:
A negative relationship between variables can also lead to a statistically significant correlation coefficient.
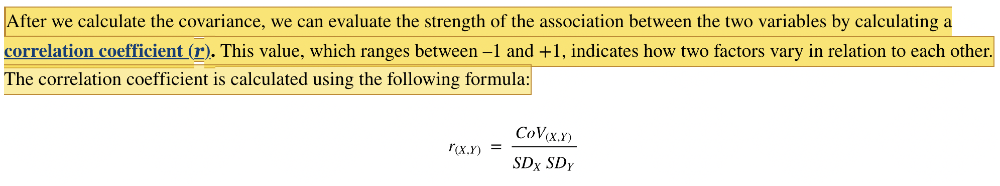
The strength of the association between two variables can be reported as a value that ranges between -1 and +1. This value is called the ____ coefficient.
correlation
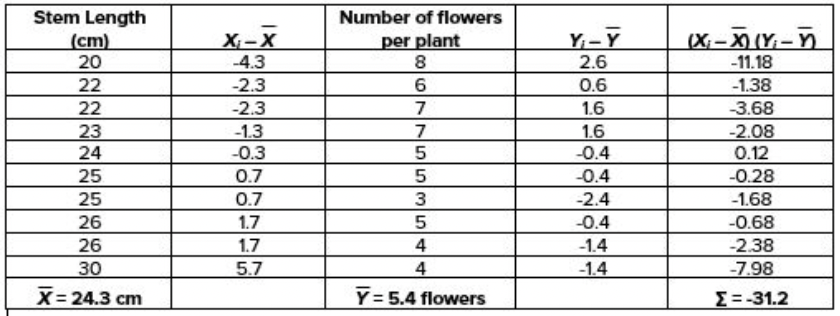
The data table shown here presents information about stem length and number of flowers per plant in a certain type of plant. What is the covariance between stem length and flower number?
-3.5
If a correlation coefficient of two traits is negative, it means that _____.
as one trait increases, the other decreases
A correlation coefficient is considered significant if ______.
statistical analysis results in a probability value greater than 0.05
Which of the following statistical values is a measure of the relationship between two variables?
Covariance
In order to analyze the significance of a(n) ____ coefficient, the sampling of the population must be unbiased, the values of both variables must follow a normal distribution, and the relationship between the two variables must be linear.
correlation
In a group of twenty ten-year-old girls, the mean height is 150 cm, and the mean weight is 30 kg. The standard deviation of height is 5 cm, and the standard deviation of weight is 2 kg. The covariance between height and weight is 8.0. What is the correlation coefficient between these two variables?
0.8
Reason:
8 / (5)(2) = 0.8
Suppose the correlation coefficient between birth weights of 22 infants and pre-pregnancy weights of their mothers is 0.338. Based on this calculation, you can conclude that the two variables show ______.
no true association
The correlation coefficient is a measure of the ______.
strength of the relationship between two variables
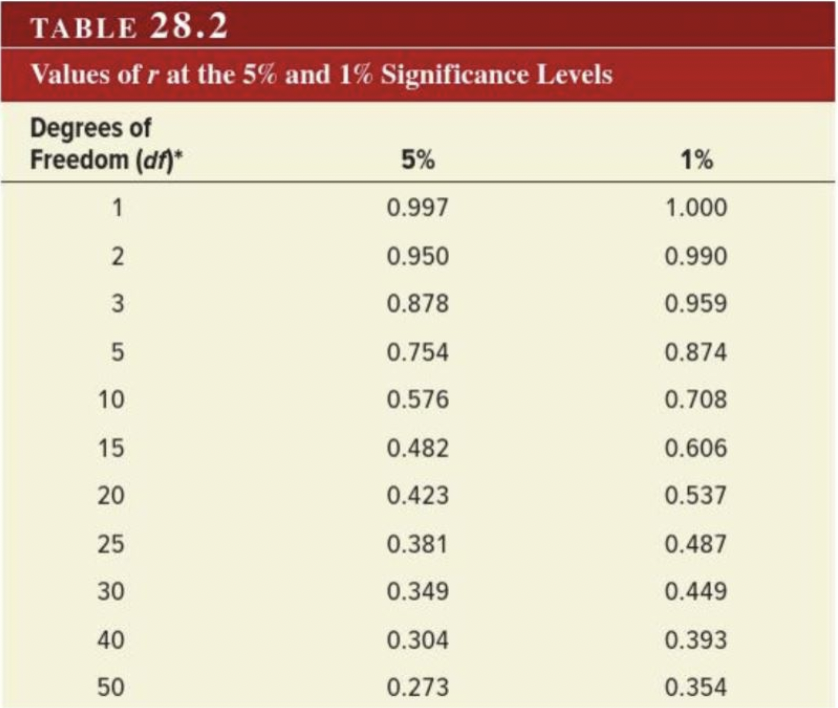
Suppose that leaf number and plant height for 32 tomato plants shows a linear relationship with a correlation coefficient of 0.642. In this case you would ____ the null hypothesis that the size of the correlation coefficient is due to random sampling error.
reject
If there is no relationship between two variables, the correlation coefficient will be ______.
zero
Quantitative traits are ______.
controlled by multiple genes
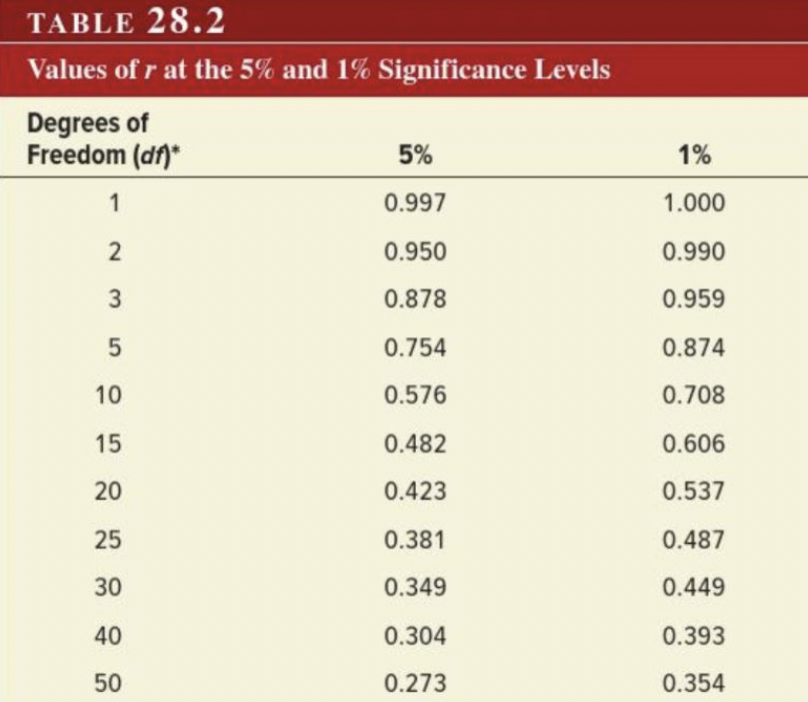
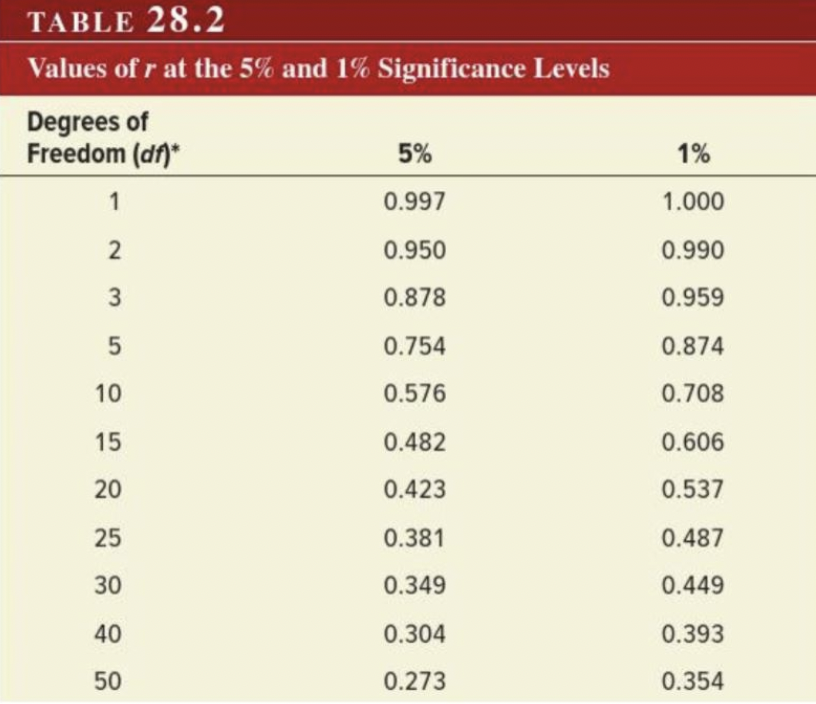
The significance of a correlation coefficient can be evaluated by ______.
determining its probability by statistical analysis
Reason:
The r value is compared to tabulated values at 5% and 1% significance.
What assumptions must be met in order for a correlation coefficient to be valid?
The relationship between the values of the two variables is linear.
The sampling of the entire population being studied is unbiased.
The values of both variables follow a normal distribution.
Polygenic inheritance is the transmission of a trait that is determined by ______.
two or more different genes
A study of mineral accumulation in 52 rice plants showed a linear relationship between iron content and zinc content with a correlation coefficient of 0.765. Based on this calculation, you can conclude that the two variables show ______.
Answer Choices:
a true association
a cause and effect relationship
no association
a true association
Suppose that milk volume and body weight for 27 Guernsey cows shows a linear relationship with a correlation coefficient of 0.187. In this case you cannot ____ the null hypothesis that the size of the correlation coefficient is due to random sampling error.
reject
Quantitative traits tend to show a continuum of variation because they are usually ____, meaning that they are controlled by multiple genes.
polygenic
Transmission of a trait determined by two or more different genes is referred to as ____ inheritance.
polygenic
How many genes control hull color in bread wheat?
Two
In bread wheat, hull color is determined by two genes. For the first gene, the R1 allele produces red color, and the r1 allele produces white color. Similarly, the R2 allele results in red pigment, and the r2 allele does not. The effects of the red alleles are additive. In a self-cross of a strain with genotype R1r1R2r2, what phenotypic ratio is expected in the offspring?
1:4:6:4:1
Reason:
Polygenic traits do not exhibit expected Mendelian ratios.
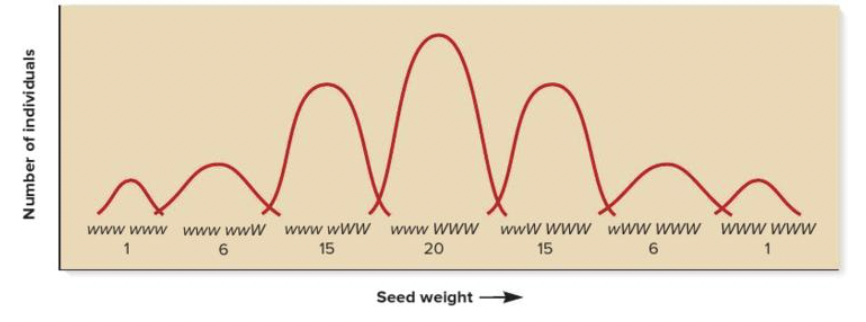
The graph shows a hypothetical situation in which seed weight is controlled by three genes, each with light (w) and heavy (W) alleles, and a low environmental effect. If the environmental effect were high, ______.
the overlaps between genotypes increases
What is a quantitative trait locus?
The chromosomal location of one or more genes that affect the phenotype of a quantitative trait
In QTL mapping, researchers try to identify the association between ______.
molecular markers and the phenotypes of quantitative traits
Reason:
QTL mapping seeks to determine relationships between phenotypes and molecular markers.
In bread wheat, the color of the hull can be dark red, white, or various intermediate shades of red. Genetic analysis of this trait has demonstrated that it is controlled by ______.
two loci with additive effects on hull color
Click and drag on elements in order
Place the steps in QTL mapping in order, with the first step at the top.
Answer in the picture.
In a certain type of plant, the stem is always at least 20 centimeters long. Two genes (A and B) with additive alleles influence the stem length. For these two genes, each dominant allele adds an additional 2 cm to the length of the stem; the recessive alleles do not change the length of the stem. If a plant with the genotype AaBb is allowed to self-cross, what proportion of the offspring will be 22 cm tall?
4/16
Reason:
Polygenic traits do not exhibit expected Mendelian ratios.
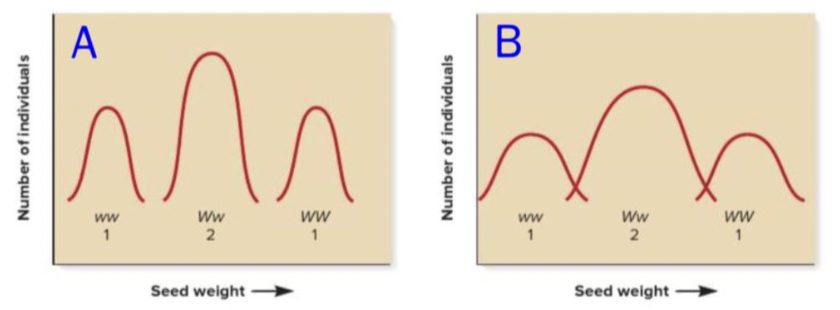
The graphs show the relationship between seed weight and genotype for a single gene that influences seed weight. Which statement describes the difference between the two graphs?
Graph A shows a low environmental effect on seed weight, whereas Graph B shows a high environmental effect
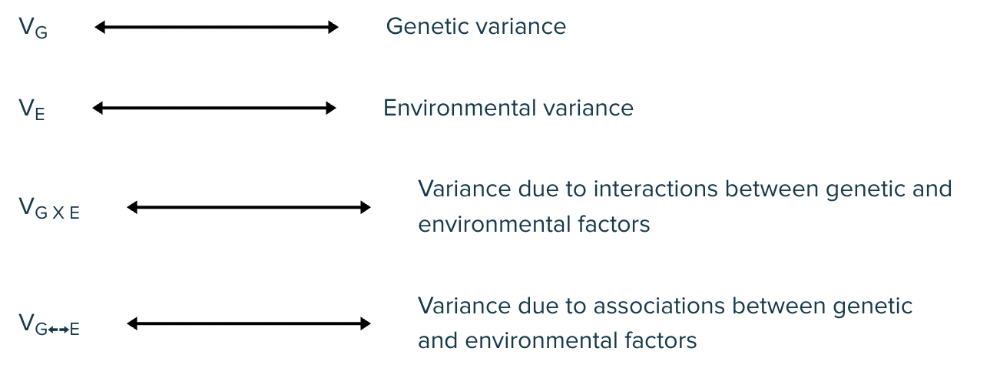
When a quantitative trait is analyzed, its phenotypic variance can be partitioned into ____ variance, ____ variance, and the interactions and associations between them.
genetic; environmental
The chromosomal location of one or more genes that influence a quantitative trait is called a quantitative trait
locus or loci
When phenotypic variance is determined solely by genotypic and environmental variance, and genetic and environmental factors are independent of one another, then total phenotypic variance is equal to genetic variance ____ environmental variance.
plus, +, or and
The purpose of QTL mapping is to ______.
identify the chromosomal locations of genes that influence a quantitative trait
Reason:
The basis of QTL mapping is the association between genetically determined phenotypes for quantitative traits and molecular markers.
In which situation does genetics play a greater role than the environment in promoting phenotypic variation within a group?
When V G is high and V E is low
Reason:
If V G is very high and V E is very low, genetics plays a greater role in promoting phenotypic variation.
In a QTL mapping experiment, the two strains that are selected for breeding must ______.
differ with respect to a quantitative trait
be highly inbred
Mating between close relatives, such as brothers and sisters, is referred to as
inbreeding
The phenotypic variance of a quantitative trait can be partitioned into several components. Match each component of variation to the correct description.
Answer in the picture.
In inbred strains of mice, all phenotypic variance is due to ______.
environmental variance
Reason:
VG equals 0 for inbred strains of mice.
When genetic and environmental factors are independent of one another, and genetic variance (V G) and environmental variance (V E) are the only factors that determine phenotypic variance (V P), then V P is equal to the ______.
sum of V G and V E.
A population in which all members of the population are homozygous for the same allele of a given gene is referred to as ______.
monomorphic
When the genetic variance for a trait is low and the environmental variance is high, most of the phenotypic variation within a group can be attributed to ______ factors.
environmental
Reason:
With low genetic variance, environmental factors play a greater role in variation.
In a group of genetically homogeneous mice, the phenotypic variance for weight is 10 g2. In a group of genetically heterogeneous mice, the phenotypic variance for weight is 25 g2. Based on this information, what are the genetic, environmental, and phenotypic variances for this trait in the heterogeneous mice?
V G = 15 g2, V E = 10 g2, and V P = 25 g2
Reason:
V E = variance for the homogenous mice. V G = difference in variance between heterogenous and homogenous mice. V p = total phenotypic variance.
Reason:
V E = variance for the homogenous mice. V p = total phenotypic variance.
Reason:
V E = variance for the homogenous mice. V G = difference in variance between heterogenous and homogenous mice.
Reason:
V E = variance for the homogenous mice. V G = difference in variance between heterogenous and homogenous mice. V p = total phenotypic variance.
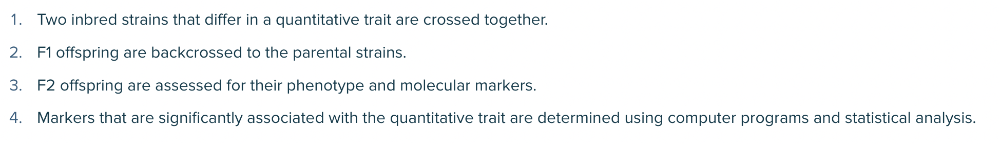
In QTL mapping, after two inbred strains are crossed with one another, the F1 offspring are backcrossed to both parental strains. Researchers next analyze the association between ______.
the phenotype being studied and molecular markers on the chromosomes
Genotype-environmental interaction (represented by V G x E ) is ______.
variance attributed to interactions between genetic and environmental factors
What is inbreeding?
Mating between close relatives
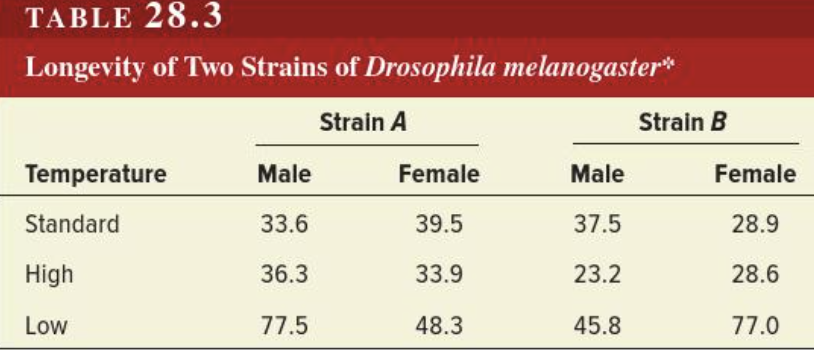
The data table shown here presents the longevity of two different strains of fruit flies at three different temperatures. The variation in longevity reported here is best described as ______.
a genotype-environment interaction
In an inbred strain of mice, the genetic variance for a quantitative trait is equal to ______.
0
Reason:
Monomorphic members of a population are all homozygous for the same allele of a given gene. Within such an inbred strain of mice, the VG equals zero.
The tendency of certain genotypes to be found preferentially in particular environments is called a genotype-environment ____.
association
Monomorphic members of a population ______.
are homozygous for the same allele of a given gene
In a genetically homogeneous group of fruit flies, the phenotypic variance for abdominal bristles is 4 bristles2. In a genetically heterogeneous group of fruit flies, the phenotypic variance for abdominal bristles is 12 bristles2. What are the genetic, environmental, and phenotypic variances for this trait in heterogeneous flies?
V G = 8 bristles2, V E = 4 bristles2, and V P = 12 bristles2
Reason:
VP = VG + VE; where VP is the total phenotypic variance; VG is the relative amount of variance due to genetic variation; VE is the relative amount of variance due to environmental variation.
A genotype-environmental interaction exists when _______.
the environmental effects on phenotype differ according to genotype
In studies of human genetics, the effects of genotype-environment associations can be minimized by studying _______.
siblings adopted at birth by different parents
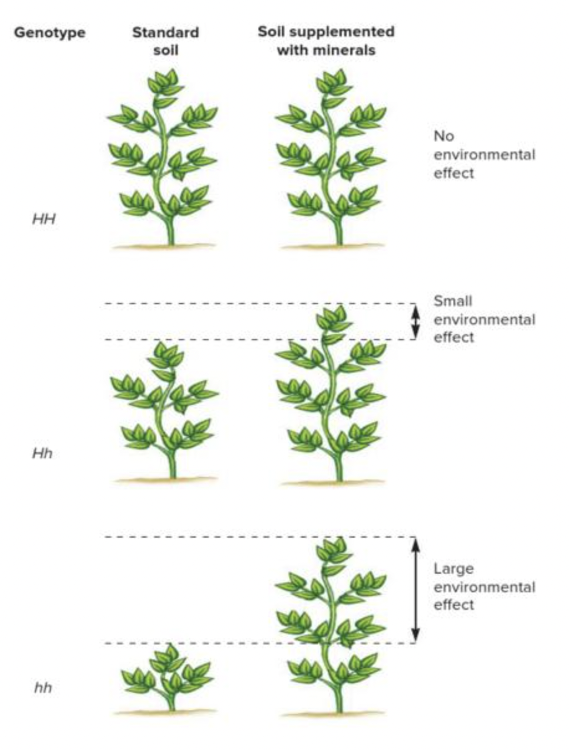
This figure depicts the varying effects of environmental factors on plants with three different genotypes. The variation represented here is best described as ______.
a genotype-environment interaction
A genotype-environment association is ______.
the increased likelihood of finding certain genotypes in a particular environment
A population in which all members of the population are homozygous for the same allele of a given gene is referred to as ______.
monomorphic
Heritability is a measurement of the ______.
proportion of phenotypic variance due to genetic variance
Genetic studies that compare quantitative traits in identical versus fraternal twins can be used to evaluate how a quantitative trait is affected by _______.
genotype-environment associations
If all of the phenotypic variation for a trait is due to environmental effects, not to genetic variation in the population, then the heritability of the trait will be equal to ______.
0
Reason:
If the phenotypic variance is due to genetic variance, the heritability would have a value of 1.
In a population of dairy cows, the phenotypic variance for daily milk production is 5.0 L2. The genetic variance is 2.0 L2, and the environmental variance is 3.0 L2. What is the broad-sense heritability for daily milk production in this group of cattle?
0.40
Reason:
Divide the genetic variance by the total phenotypic variance. (2.0/5.0 = 0.40)
The tendency of certain genotypes to be found preferentially in particular environments is called a genotype-environment ____.
association
Which component of genetic variance is attributed to alleles that have additive effects?
V A
For a particular population in a particular environment, the fraction of phenotypic variance that is due to genetic variance is called ____.
heritability
Which one fits the situation where the narrow-sense heritability will be similar to the broad-sense heritability for a quantitative trait?
V A is large compared to V D and V I
In a population of chickens, the phenotypic variance for egg weight is 20 g2. VE = 8 g2, VG = 12 g2, and VA = 5 g2. What is the narrow-sense heritability of egg weight in this population of chickens?
0.25
Reason:
Divide VA by VT, where VT is the phenotypic variance.
If the heritability value of a trait is equal to 1, it means that ______.
all of the phenotypic variation in the population is due to genetic variance
Reason:
If the heritability value of a trait is equal to 1, it means that none of the genetic variation is due to environmental effects. All of the phenotypic variation in the population is due to genetic variance.
If the observed phenotypic correlation coefficient between related individuals is 0.20 and the expected correlation coefficient based on the known genetic relationship is 0.50, then the narrow-sense heritability for the trait is ______.
0.40
Reason:
Divide the observed value by the expected value. (0,20 / 0.50 = 0.40)
In a group of mice, the total phenotypic variance for body weight is 12.0 g2. The genetic variance is 9.0 g2, and the environmental variance is 3.0 g2. What is the broad-sense heritability for this trait?
0.75
Reason:
Divide the genetic variance by the total phenotypic variance. (9/12 = 0.75)
True or false: In order to calculate narrow-sense heritability from correlation coefficients, it is necessary to assume that genetics and the environment are independent variables.
True
Reason:
This assumption must be made in order to calculate narrow-sense heritability based on correlation coefficients.
Genetic variance can be partitioned into three distinct categories. Match each type of variance with the correct description.
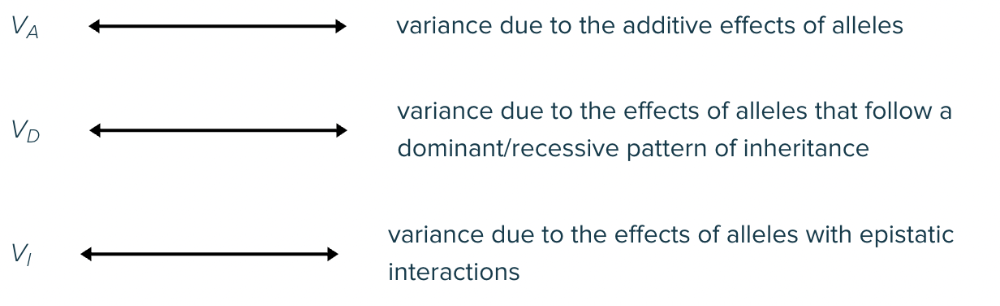
VA: variance due to the additive effects of alleles
VD: variance due to the effects of alleles that follow a
dominant/recessive pattern of inheritance
VI:variance due to the effects of alleles with epistatic interactions
To study the heritability of human fingerprints, the ______.
fingerprints categorized as to whether they contain mostly arches, loops, or whorls
most unique finger is selected as a representative and the total length of the ridges is determined
lengths of all fingerprint ridges for all 10 fingers are added
number of ridges that cross a line is counted for all 10 fingers
number of ridges that cross a line is counted for all 10 fingers
If VA is very large in comparison to VD and VI, then narrow-sense heritability will be ______ broad-sense heritability.
approximately the same as
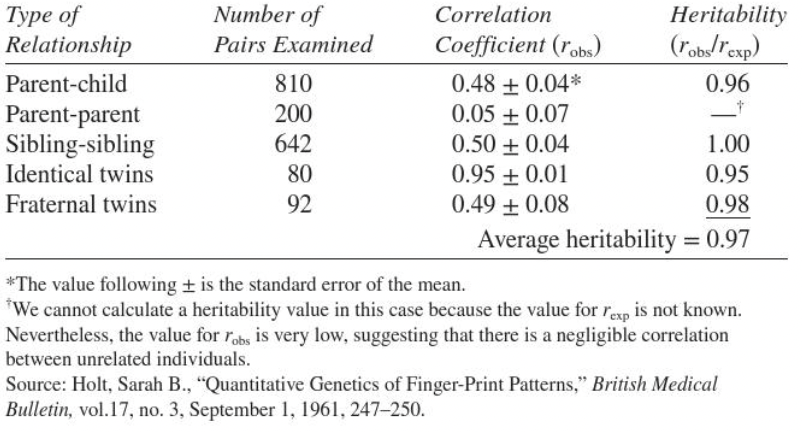
The table shown here presents data collected about fingerprint patterns. Based on the information in this table, which of the following conclusions is supported?
Most of the variability in fingerprint patterns can be explained by genetic variation among individuals.
In a certain type of plant, the phenotypic variance for height is 10 cm2. VE = 6 cm2, VG = 4 cm2, and VA = 2 cm2. What is the narrow-sense heritability for this trait?
0.2
Reason:
Divide VA by VT, where VT is the phenotypic variance.
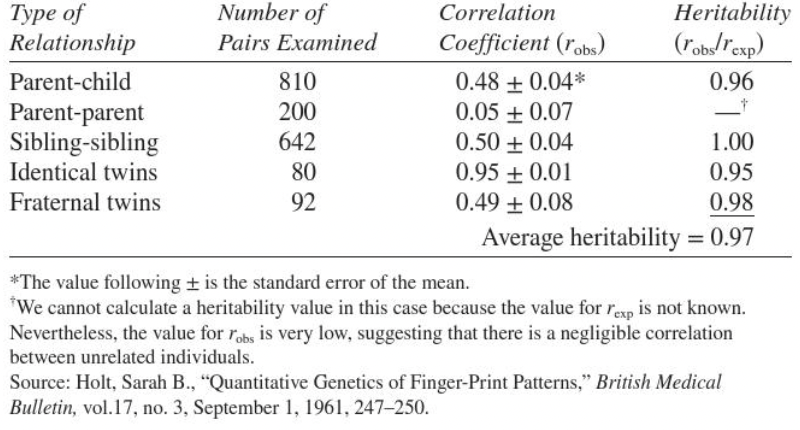
As shown in the table, the correlation coefficient for fingerprint patterns between identical twin pairs is ______ than for pairs of fraternal twins, showing that the phenotypic variance is due to almost entirely to ______ variance.
higher; genetic
For a certain trait, the expected correlation coefficient for an aunt-niece relationship is 0.25. In a group of aunts and nieces, the observed correlation coefficient is found to be 0.20. What is the narrow-sense heritability for this trait?
0.80
Reason:
Divide the observed value by the expected value. (0,20 / 0.25 = 0.80)
When narrow-sense heritability is calculated from correlation coefficients, an assumption that is inherent in the computation is that ______.
genetics and the environment are independent variables
Reason:
When narrow-sense heritability is calculated from correlation coefficients, an assumption that is inherent in the computation is that genetics and the environment are independent variables.
The goal of selective breeding is to ______.
modify phenotypes in economically important plants and animals
Kristine Bonnevie developed a method to study fingerprints by drawing a line from a triradius to the center of the fingerprint and counting the number of ____ that cross the line.
ridges
The heritability of fingerprint pattern is 0.97. This means that ______.
97% of the phenotypic variance in fingerprint pattern is due to genetic variance
Reason:
High heritability values indicate that nearly all of the phenotypic variance is due to genetic variance.
Selective breeding of plants and animals can result in ______.
artificial selection
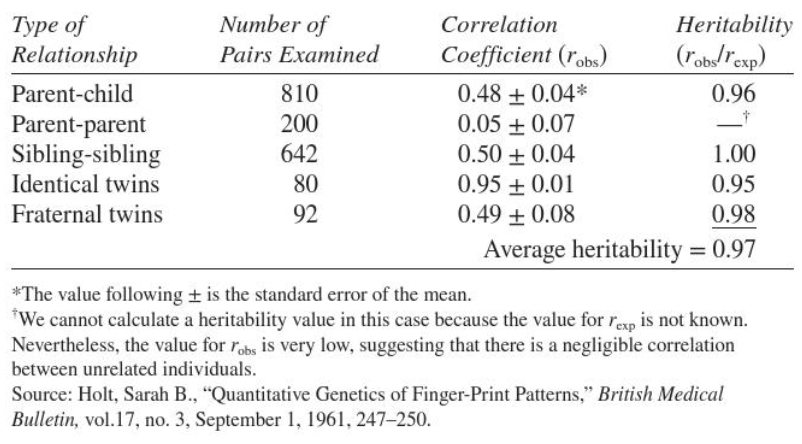
Comparing the correlation coefficients between fingerprint patterns in identical and fraternal twin pairs as shown in the table, you can conclude that the phenotypic variance in patterns is ______.
mostly due to genetic variance
What is the difference between natural selection and artificial selection?
Natural selection favors reproductive success, while artificial selection favors traits that are desirable to humans.
If the observed phenotypic correlation coefficient between related individuals is 0.20 and the expected correlation coefficient based on the known genetic relationship is 0.50, then the narrow-sense heritability for the trait is ______.
0.40
Reason:
Divide the observed value by the expected value. (0,20 / 0.50 = 0.40)
A certain allele of the insulin-like growth factor 1 gene is very common in small dogs but is almost absent from large breeds of dogs. The differences in the prevalence of this allele in different types of dogs can be attributed to ______.
selective breeding
A breeding strategy designed to modify phenotypes in an economically important plant or animal is called breeding.
selective
True or false: In order for selective breeding to be successful in modifying a quantitative trait, there must be genetic differences among individuals in a group.
True
Reason:
Genetic differences among individuals are essential in order for selective breeding to be successful.
To study the heritability of human fingerprints, the ______.
number of ridges that cross a line is counted for all 10 fingers
The modification of phenotypes of economically important plants and animals through selective breeding is referred to as ____ selection.
artificial or truncation
In the figure, the outcome of selective breeding of corn with high or low oil content over 77 generations is shown. The results demonstrate that selective breeding can modify a(n) ______ in a directive manner.
quantitative trait
When a breeder chooses individuals with desirable traits to be parents, the result is ____ selection. When environmental factors favor traits that enhance reproductive success, the result is ____ selection.
artificial; natural
In an unselected population, a quantitative trait is most likely to be at a(n) ______ value.
intermediate
Kale, broccoli, Brussels sprouts, cabbage, and kohlrabi have all been derived from the wild mustard plant by ____ breeding.
selective
The success of selective breeding in modifying quantitative traits can be attributed to ____ variation among individuals.
genetic, allelic, or allele
What is a selection limit?
A plateau for the value of a trait where artificial selection is no longer effective
After many generations of selective breeding, a selection limit may be reached because ______.
the population is monomorphic for most of the alleles that affect the trait of interest
Reason:
Repeated selective breeding may result in a monomorphic population.
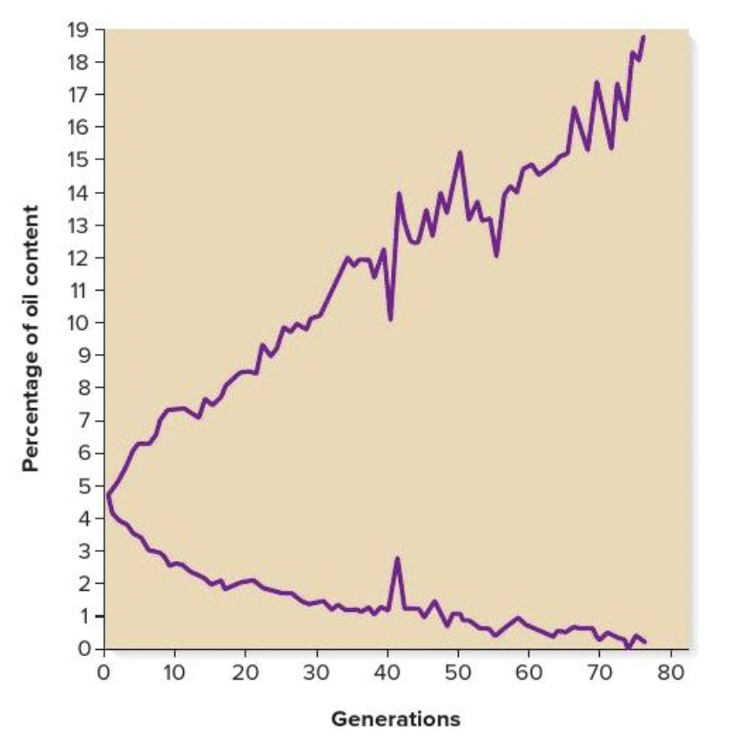
The figure shows that selective breeding for 77 generations produced corn strains of differing oil content, one with over ____% oil content and another with less than ____% oil content.
18; 1
In a group of plants that has not been subjected to selective breeding for height, plant height is most likely to be ______ in value.
intermediate
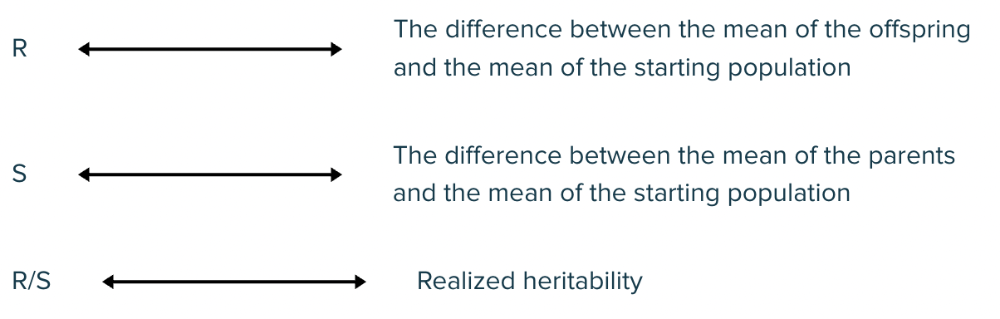
What is realized heritability?
Narrow-sense heritability that is estimated based on the response to artificial selection
Reason:
Realized heritability equates with narrow-sense heritability measured with artificial selection experiments.
A certain allele of the insulin-like growth factor 1 gene is very common in small dogs but is almost absent from large breeds of dogs. The differences in the prevalence of this allele in different types of dogs can be attributed to ______.
selective breeding
After the use of selective breeding for many generations, a trait will often reach a plateau where artificial selection is no longer effective. This plateau is called a selection ____.
limit
A farmer is interested in increasing the length of the ears of corn in his field. He begins with corn with an average ear length of 15.0 cm. From his starting population, he selectively breeds plants with an average ear length of 20.0 cm. In the next generation, the average ear length is 18.0 cm. What is the realized heritability?
0.60
Reason:
Divide the response in the offspring to selection by the selection differential in the parents.
True or false: Selective breeding may result in a selection limit due to the accumulation of alleles that have a negative effect on fitness.
True
Reason:
Artificial selection for one trait can result in the accumulation of alleles that have a negative impact on overall fitness. This can result in a selection limit.
When narrow-sense heritability is estimated based on the response to artificial selection, it is referred to as heritability.
realized
To calculate realized heritability based on the results of selective breeding, it is necessary to know the value of R, which represents the ____ to selection observed in the offspring, and also the value of S, which represents the ____ differential of the parents.
response; selection
Narrow-sense heritability can be used to predict ______.
the expected change in the population mean for a trait that can be achieved through artificial selection
In a population of mice, the average tail length is 8.0 cm. A researcher who wants to breed mice to have longer tails selects parents from this group of mice with an average tail length of 10.0 cm. The offspring of this cross have an average tail length of 8.5 cm. What is the realized heritability?
0.25
Reason:
Divide the response in the offspring to selection by the selection differential in the parents.
In a certain plant, the mean plant height is 30 cm. From this population of plants, a breeder selects individuals with a mean height of 36 cm and uses them for selective breeding. If narrow-sense heritability for height is 0.8, then what is the expected mean height of the plants in the next generation?
34.8 cm
Reason:
The next generation will be 4.8 cm taller than the mean starting population. [0.8 (36-30) = 4.8] Thus, 30 + 4.8 = 34.8 cm.
Inbreeding may promote homozygosity for deleterious alleles. This phenomenon is referred to as inbreeding
depression
Match each variable involved in the calculation of realized heritability with the correct description.
Answer in the picture.
The proportion of phenotypic variance that can be used to predict changes in the population mean through artificial selection is the ____-sense heritability.
narrow
What is heterosis?
The increased vigor observed in the offspring of a cross between two different inbred lines
A cattle breeder wants to increase the average birth weight of calves in his herd. In his original herd, the average birth weight is 580 kg. From this population, he selects breeders whose average birth weight was 630 kg. If the narrow-sense heritability of birth weight is 0.75, then what average birth weight is expected in the next generation?
617.5 kg
Reason:
0.75 (630 kg-580 kg) = 37.5kg ; 580kg + 37.5 kg = 617.5 kg
What is inbreeding depression?
The tendency for inbreeding to promote homozygosity for deleterious alleles
Charles Davenport proposed that hybrid vigor is due to ______.
the favorable effects of dominant alleles in a hybrid
When two different inbred strains are bred with one another, their offspring are often larger and/or longer-lived than either of the inbred parental strains. This phenomenon is called hybrid vigor, or ____.
heterosis
According to the overdominance hypothesis, which of the following individuals would have the greatest fitness?
A heterozygote
Hybrid vigor is most likely due to the fact that when highly inbred strains are crossed with one another, their offspring are ______ for deleterious recessive alleles carried by each of the two strains.
homozygous recessive
Reason:
In the homozygous state, recessive alleles may be deleterious.
When neither of two alleles is recessive and the heterozygote is more vigorous than either homozygote, a phenomenon called has occurred.
overdominance