Which is a characteristic of the mean as a measure of center?
a) It is less reliable than the mode when the data are
continuous
b) Deviations do not sum to zero when there are
extreme values
c) It is usually equal to the median in business
data
d) It utilizes all the information in a sample
d) It utilizes all the information in a sample
Explanation
The mean utilizes all n data values.
Deviations always sum to zero around the mean. The mean works for
continuous data (unlike the mode). The mean often differs from the
median in business data.
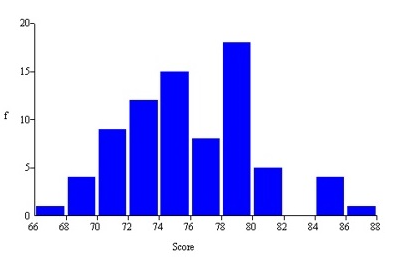
This histogram shows Chris's golf scores in his last 77 rounds at Devil's Ridge. Which is not a correct statement?
a) About 15 percent of his scores are in the interval
74<76
b) The number of bins is consistent with Sturges'
Rule
c) The histogram has a noticeable bimodal shape
d) The
modal class is 78<80
b) The number of bins is consistent with Sturges' Rule
Explanation
Sturges’ Rule suggests k = 1 + 3.3 log
(77) = 7.22, or about 7 bins.
Which is the Excel formula for the standard deviation of a sample array named Data?
a) =STDEV.S(Data)
b) =SUM(Data)/(COUNT(Data)-1)
c)
=STDEV.P(Data)
d) =STANDEV(Data)
a) =STDEV.S(Data)
Explanation
STDEV.S(Data) denotes a sample standard deviation.
A line chart would not be suitable to display which data?
a) Exxon-Mobil's quarterly sales data for the last five
years
b) Annual compensation of the top 50 CEOs
c) U.S. oil
imports from OPEC nations for the last 20 years
d) Daily stock
market closing prices of Microsoft for the past month
b) Annual compensation of the top 50 CEOs
Explanation
Line charts are for time series data (not
cross-sectional data).
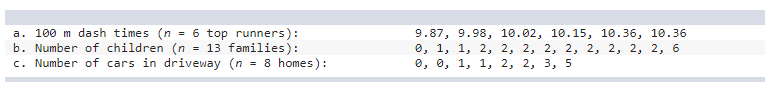
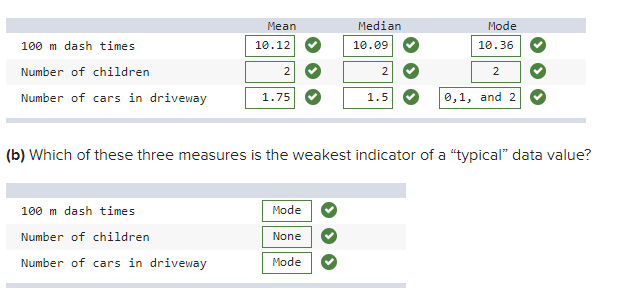
a) Find the mean, median, and mode for each data set.
b) Which
of these three measures is the weakest indicator of a
"typical" data value?
(a)
100m dash times:
Mean=9.87+9.98+10.02+10.15+10.36+10.366=10.12Mean=9.87+9.98+10.02+10.15+10.36+10.366=10.12
Median=10.02+10.152=10.085Median=10.02+10.152=10.085
Mode
= 10.36
Number of children:
Mean=0+1+1+2+2+2+2+2+2+2+2+2+613=2Mean=0+1+1+2+2+2+2+2+2+2+2+2+613=2
Mode
= 2
Median = 2
Number of cars in driveway:
Mean=0+0+1+1+2+2+3+58=1.75Mean=0+0+1+1+2+2+3+58=1.75
Median=1+22=1.5Median=1+22=1.5
Mode
= 0,1, and 2
(b)
100m dash times:
The mode is the weakest because all of the values fall at or
below 10.36. We also know that the mode should be used for a small
range of discrete data or attribute data. This is a small range of
continuous data.
Number of children:
All measures of
central tendency in this case have the same value of 2, which is a
strong indicator of a "typical" data value.
Number of cars in driveway:
The mode is the weakest because
there are three different values for mode and only five unique values
in the entire data set.
Which type of data (cross-sectional or time series) is each variable?
a) Mexico's GDP for each of the last 10 quarters.
b)
Unemployment rates in each of the 31 states in Mexico at the end of
last year.
c) Unemployment rate in Mexico at the end of each of
the last 10 years.
d) Average home value in each of the 10
largest Mexican cities today.
a) Time series
b) Cross-sectional
c) Time series
d) Cross-sectional
The target population is all stocks in the S&P 500 index. Is each of the following a parameter or a statistic?
a) The average price/earnings ratio for all 500 stocks in the
S&P index.
b) The proportion of all stocks in the S&P 500
index that had negative earnings last year.
c) The proportion of
energy-related stocks in a random sample of 50 stocks.
d) The
average rate of return for 20 stocks recommended by a broker.
Explanation
(a) Parameter. The S&P is the population.
(b) Parameter. Same as above. The S&P is the
population.
(c) Statistic. We clearly stated a random
sample.
(d) Statistic. This isn’t random, but it could be
considered a sample.
Would you use a sample or a census to measure each of the following?
a) The number of cans of Campbell's soup on your local supermarket's
shelf today at 6:00 p.m.
b) The proportion of soup sales last
week in Boston that was sold under the Campbell's brand.
c) The
proportion of Campbell's brand soup cans in your family's pantry.
Explanation
(a) Census. It would be easy enough to count all of
them.
(b) Sample. It would be too costly to track each
can.
(c) Census. You can count them all quickly and cheaply.
For each data set, is the mode a good measure of center?
a) Genders of 12 CEOs: M, M, F, M, F, M, M, M, F, M, M, M
b)
Ages of 10 college freshmen: 17, 17, 18, 18, 18, 18, 18, 18, 19,
20
c) Ages of 8 MBA students: 24, 26, 27, 28, 30, 31, 33, 37
Explanation
a. Yes
This is attribute data so mode is the only measure of
central tendency possible. Mode = M, which occurs 9 out of 12
observations.
b. Yes
This is discrete data with a
small range so mode could be an appropriate measure of central
tendency. Mode = 18, which occurs 6 out of 10 observations.
c. No
There is no mode in this case because there is no
value that occurs more than once. Therefore, either mean or median
would be more appropriate. Mean = 29.5 and median = 29.
A certain health maintenance organization (HMO) is studying its daily office routine. It collects information on three variables: the number of patients who visit during a day, the patient’s complaint, and the waiting time until each patient sees a doctor.
a) Which variable is categorical?
- The
number of patients who visit during a day
- The waiting time
until each patient sees a doctor
- The patient's
complaint
b) Identify the two quantitative
variables and state whether they are discrete or continuous.
a) The patient's complaint
b) The number of patient visits is
discrete numerical. The waiting time is continuous.
Consider the following table of data.
a) Select the correct chart to display the above data
b) Would
more than one kind of display be acceptable for this data?
- Yes, a bar chart or column chart would also work.
- No,
other charts would not work for this data.
- Yes, a line chart
would also work.
a) Chart A
b) Yes, a bar chart or column chart would also work.
One disadvantage of the range is that
a) it is expressed in different units than the mean.
b) it is
undefined if any X values are 0 or negative.
c) it does
not exist for some data sets.
d) only extreme values are used in
its calculation.
d) only extreme values are used in its calculation.
Explanation
Range ignores all the sample except the extremes x
max and x
min.
Noodles and Company tested consumer reaction to two spaghetti Sauces.
Each of 70 raters assessed both Sauces on a scale of 1 (worst) to 10
(best) using several taste criteria. To correct for possible bias in
tasting order, half the raters tasted Sauce A first, while the other
half tasted Sauce B first. Actual results are shown below for “overall
liking.”
Sauce A:
6, 7, 7, 8, 8, 6, 8, 6, 8, 7, 8, 8,
6, 8, 7, 7, 7, 8, 8, 8, 7, 7, 6, 7, 7,
8, 3, 8, 8, 7, 8, 6, 7, 8,
7, 7, 3, 6, 8, 7, 1, 8, 8, 7, 6, 7, 7, 4, 8, 8,
3, 8, 7, 7, 7, 5,
7, 7, 7, 9, 5, 7, 6, 8, 8, 8, 4, 5, 9, 8
Sauce B:
7,
7, 7, 8, 8, 7, 8, 6, 8, 7, 7, 6, 7, 7, 8, 7, 8, 7, 8, 8, 7, 8, 5, 7,
7,
9, 4, 8, 8, 7, 8, 8, 8, 8, 7, 7, 3, 7, 9, 8, 9, 7, 8, 8, 6, 7,
7, 7, 8, 8,
7, 7, 8, 6, 6, 7, 7, 9, 7, 9, 8, 8, 6, 7, 7, 9, 4, 4,
9, 8
a) Calculate the mean and standard deviation for each
sample.
b) Calculate the coefficient of variation for each
sample.
c) What is your conclusion about consumer preferences for
the two Sauces?
- On average, consumers seem to prefer Sauce A
over Sauce B.
- On average, consumers seem to prefer Sauce B
over Sauce A.
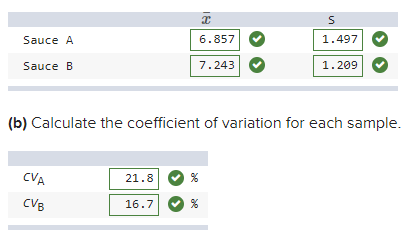
c) On average, consumers seem to prefer Sauce B over Sauce A.
Explanation
(a)
x¯A=6.86,SA=1.497,x¯B=7.24,SB=1.209 x¯A=6.86,SA=1.497,x¯B=7.24,SB=1.209
(b)
CVA =1.497/6.86=0.218 or 21.8%,CVB =1.209/7.24 = 0.167 or 16.7%CVA =1.497/6.86=0.218 or 21.8%,CVB =1.209/7.24 = 0.167 or 16.7%
(c)
Consumers preferred Sauce B. Sauce B also had more consistent
ratings relative to the average.
Which distribution is least likely to be skewed to the right by high values?
a) Annual incomes of n passengers on a flight from New York
to London
b) Weekend gambling losses of n customers at a
major casino
c) Cost of a plain McDonald’s hamburger in
n U.S. cities
d) Accident damage losses by n
renters of an auto rental company
c) Cost of a plain McDonald’s hamburger in n U.S. cities
Explanation
A few high values would skew the data badly in all
but the hamburger example, because a McDonald’s hamburger is a
standard menu item.
Consider the following sample data:
Sample A: 6, 7, 8
Sample B: 61, 62, 63
Sample C: 1,000;
1,001; 1,002
a) Find the mean and standard deviation for each sample.
b)
What does this exercise show about the standard deviation?
- The
idea is to illustrate that the standard deviation is not a function of
the
value of the mean.
- The idea is to illustrate that
the standard deviation is a function of the value
of the mean.
a) Sample A: Sample B: Sample C:
Mean = 7 62 1,001
Sample
Std Deviation = 1 1 1
b) The idea is to illustrate that the standard deviation is not a function of the value of the mean.
Explanation
(b)
The midpoint of each sample is the mean. The other 2 data points
are exactly 1 standard deviation from the mean. The idea is to
illustrate that the standard deviation is not a function of the value
of the mean.
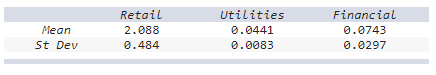
The asset turnover ratio (ATR) is the ratio of a company’s revenues to the value of its assets (indicating its efficiency in deploying its assets). We should not use the standard deviation to compare ATR variation among industrial sectors because firms with large asset bases (e.g., utilities, financial) typically have lower mean ATR than, say, retail firms.
a) Use the sample data to calculate the coefficient of variation for
each sector. (Round your answers to 2 decimal places.)
b) Which sector has the highest degree of relative
variation? The lowest?
- The _______ sector has the highest
relative variation and ______ has the lowest relative
variation.
c) If someone (incorrectly) used the standard
deviations to compare variation, would the ranking among sectors be
the same?
Explanation
(a)
The ATR coefficient of variation for Retail: 23.18%, for
Utilities: 18.82%, for Financial: 39.97%
(b) The financial sector has the
highest relative variation and utilities has the
lowest relative variation.
(c)
If one were to compare standard deviation instead of CV then it
would appear that the retail sector has the highest variability.
Which survey questions below would be suitable for a set of check boxes providing choices for the respondent to choose from? (You may select more than one answer. Click the box with a check mark for the correct answer and double click to empty the box for the wrong answer.)
Check All That Apply
a) How concerned are you for the environment?
b) What company
do you work for?
c) What is your salary range?
d) What was
the amount of your last utility bill?
a) How concerned are you for the environment?
c) What is your salary range?
Explanation
When asking about your level of concern for the
environment, possible choices include “Very,” “Moderately,” or “Not at
all.” Likewise, when asking what your salary range is, possible
choices include “$0 to $25,000,” “$25,001 to $40,000,” or “$40,001 to $75,000.”
What type of data (categorical, discrete numerical, or continuous numerical) is each of the following variables?
a) The manufacturer of your car.
b) Your college major.
c)
The number of college credits you are taking.
a) Categorical
b) Categorical
c) Discrete Numerical
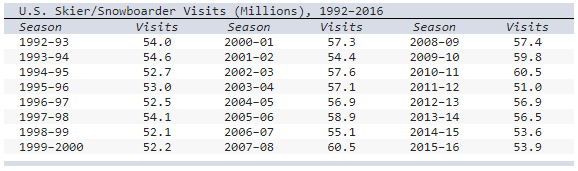
The table shows the number of visits to Skier/Snowboarder from 1992 to 2016 in US.
a) Select the line chart of the Skier/snowboarder data.
b)
Describe the pattern, if any.
- The number of visits showed a
steady decrease until a sharp high in 2010-
2011 season.
-
The number of visits showed a steady increase until a sharp drop in
2011-
2012 season.
- The number of visits showed a steady
increase until a sharp drop in 2005-
2006 season.
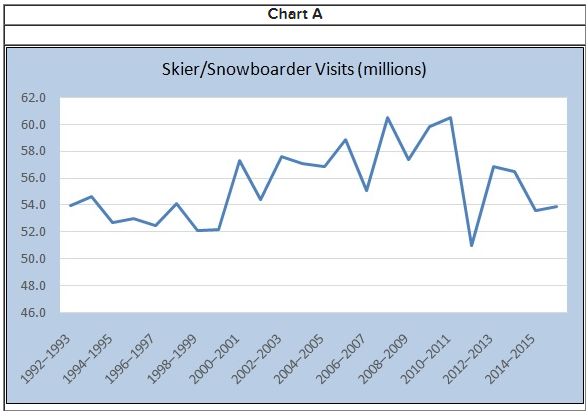
a) Chart A
b)The number of visits showed a steady increase until
a sharp drop in 2011-2012 season.
Explanation
(b)
In spite of variation from year to year the number of visits
showed a steady increase until a sharp drop in 2011-2012 season.
For each data set, find the mean, median, and mode.
a) Campus health center visits (12 students): 0, 0, 0, 0, 0, 1, 2,
3, 3, 5, 5, 15 (Round your answers to 2 decimal places.)
b) Red Rocks ticket prices (9 concerts): 40, 40, 65,
71, 72, 75, 76, 78, 98 (Round your answers to 2 decimal places.)
c) Sodium grams in canned soup (8 varieties): 225, 255, 295, 302, 304, 337, 351, 366 (Round your answers to 2 decimal places.)
Explanation
(a)
Mean = 2.83, Median = 1.5, Mode = 0. Any one of these would be a
useful measure of center. Data appears skewed right with many values
equal to zero so one might choose median or mode over mean.
(b)
Mean = 68.33, Median = 72, Mode = 40. This is continuous
numerical data so either the mean or the median would be best.
(c)
Mean = 304.38, Median = 303, No mode. This is continuous
numerical data so either the mean or the median would be best.
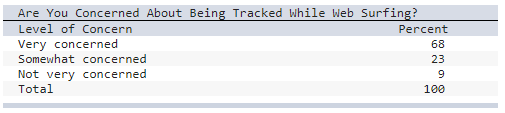
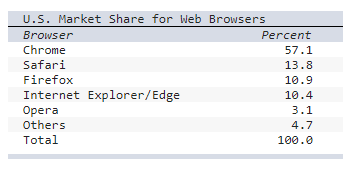
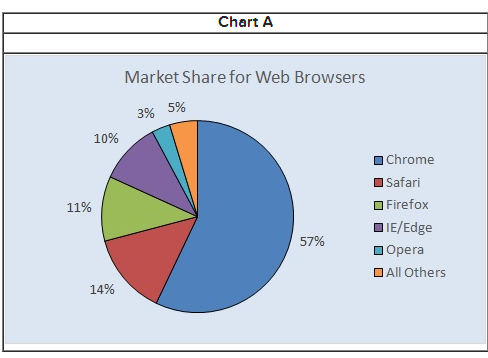
a) Select the correct 2-D pie chart for these web-surfing
data.
b) Select the correct exploded 2-D pie
chart.
c) Select the correct bar chart.
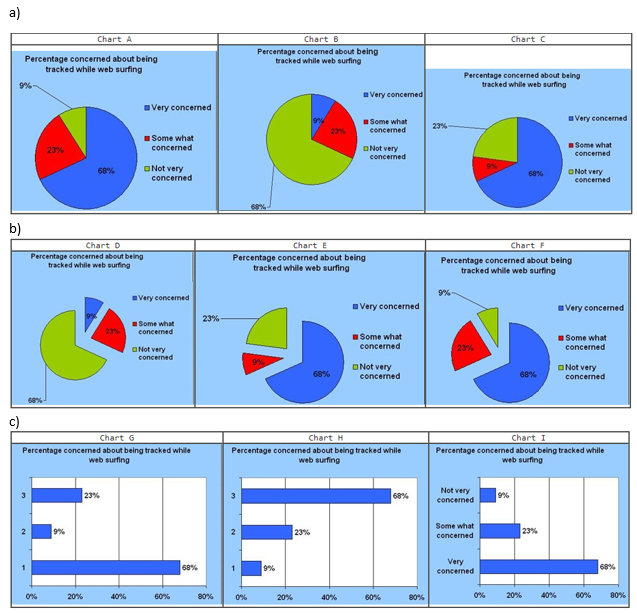
a) Chart A
b) Chart F
c) Chart I
As a measure of variability, compared to the range, an advantage of the standard deviation is that it:
a) describes the distance between the highest and lowest
values.
b) considers all data values.
c) considers only the
data values in the middle of the data array.
d) is calculated
easily through the use of a formula.
b) considers all data values.
Explanation
The range is easy to calculate but utilizes only
two data values, which may be unusual.
Five homes were recently sold in Oxnard Acres. Four of the homes sold for $400,000, while the fifth home sold for $2.5 million. Which measure of central tendency best represents a typical home price in Oxnard Acres?
a) The midrange or mean.
b) The mean or mode.
c) The
median or mode.
d) The mean or median.
c) The median or mode.
Explanation
Outliers will affect the mean or midrange.
What type of data (categorical, discrete numerical, or continuous numerical) is each of the following variables?
a) Length of a TV commercial.
b) Number of peanuts in a can of
Planter's Mixed Nuts.
c) Occupation of a mortgage
applicant.
d) Flight time from London Heathrow to Chicago O'Hare.
a) Continuous Numerical
b) Discrete Numerical
c)
Categorical
d) Continuous Numerical
Analysis of portfolio returns over a 20-year period shows the statistics below.
a) Calculate and compare the coefficients of variation.
(Round your answers to 2 decimal places.)
b) Why would we use a coefficient of variation, and why not just
compare the standard deviations?
- The standard deviations are
an "absolute", not relative, measure of dispersion.
It is best to use the CV when comparing across variables that have
different
means
- Standard deviation can only be compared
when the variables have different
units of measure.
- The
standard deviations are relative and not absolute measures of
dispersion.
c) What do the data tell you about risk and return at
that time period?
- Venture funds have greater risk and lower
return than common stocks based
on the CV.
- Venture
funds have lower risk and greater return than common stocks based
on the CV.
- Federal short-term paper has the lowest
standard deviation and hence the
greatest risk; real estate,
the lowest risk.
- Federal short-term paper has the lowest CV
and hence the greatest risk; real
estate, the lowest risk.
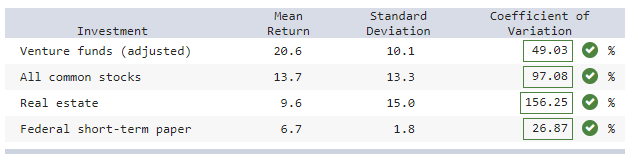
Explanation
(a) Answers in image
(b)
The standard deviations are “absolute”, not
relative, measures of dispersion. It is best to use the CV when
comparing across variables that have different means.
(c)
The risk and returns are captured by the CV.
Federal short term paper has the lowest CV and hence lowest risk, Real
estate the greatest risk. Venture funds have lower risk and greater
return than common stocks based on the CV. In other words, there is
more risk when there is more variation in the returns.
Would you use a sample or census to measure each of the following?
a) The number of workers currently employed by Campbell Soup
Company.
b) The average price of a can of Campbell's Cream of
Mushroom soup.
c) The total earnings of workers employed by
Campbell Soup Company last year.
Explanation
(a) Census. This is assuming the company can easily
generate the value from its human resource center.
(b) Sample. Impossible to observe prices of all cans
in grocery stores.
(c) Census. This should be in Campbell Soup's data base
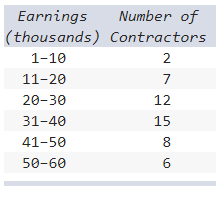
Below is a frequency distribution of earnings of 50 contractors in a country.
Regarding this distribution, which of the following is correct?
a) The frequency distribution contains too many class
intervals.
b) The class intervals are too wide.
c) The class
interval limits are ambiguous.
d) Too few classes were chosen.
c) The class interval limits are ambiguous.
Explanation
There are overlapping bin limits.
Days on the market are shown for the 36 most recent home sales in the city of Sonando Hills.
a) Calculate the mean, median, and mode. (Round your answers
to 2 decimal places.)
b) Is the distribution
skewed?
- Yes, the distribution is skewed right.
- No, the
distribution is symmetric
- Yes, the distribution is skewed
left.
c) Is the mode a useful measure of center for this data
set?
- Yes
- No
a) Mean = 98.53
Median = 98.50
Mode = 20
b) Yes, the
distribution is skewed right.
c) No
Is each of the following a parameter or statistic?
a) The number of visits to a pediatrician’s office last
week.
b) The number of copies of John Grisham’s most recent novel
sold to date.
c) The total revenue realized from sales of John
Grisham’s most recent novel.
Explanation
(a) Statistic. The week of visits is the sample.
(b) Parameter. The population is all books sold to
date.
(c) Parameter. The population is all books sold.
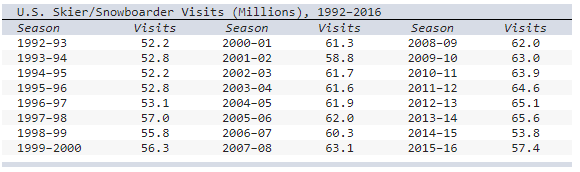
The table shows the number of visits to Skier/Snowboarder from 1992 to 2016 in US.
a) Select the line chart of the skier/snowboarder data.
b) Describe the pattern, if any.
- a steady
increase until a sharp drop in 2014-2015 season.
- The number of
visits showed a steady increase until a sharp drop in 2002-
2003
season.
- The number of visits showed a steady decrease until a
sharp high in 2014-
2015 season.
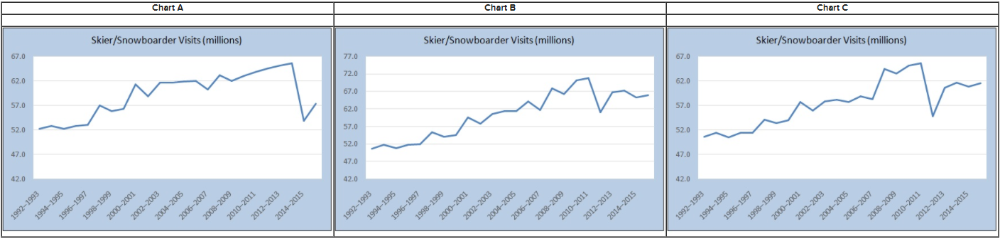
Explanation
(a)
Chart A
(b)
In spite of variation from year to year the number of visits
showed a steady increase until a sharp drop in 2014-2015 season.
Identify the following data as either time series or cross-sectional.
a) The 2017 CEO compensation of the 500 largest U.S.
companies.
b) The annual compensation for the CEO of Coca-Cola
Enterprises from 2010 to 2017.
c) The weekly revenue for a
Noodles & Company restaurant for the 52 weeks in 2017.
d) The
number of skiers on the mountain on Christmas Day 2017 at each of the
ski mountains owned by Vail Resorts.
Explanation
(a) Cross-sectional. A single point in time: end of 2017.
(b) Time series. Data are collected over an 8-year
time period.
(c) Time series. Data collected over 52 weeks.
(d) Cross-sectional. Single point in time: Christmas
Day 2017
Three randomly chosen Colorado students were asked how many times they went rock climbing last month. Their replies were 5, 6, 7. The standard deviation is
a) 1.212
b) 1.000
c) 0.816
d) 1.056
b) 1.000
The contingency table below summarizes a survey of 1,000 bottled beverage consumers.
Find the following probabilities or percentages:
a) Probability
that a consumer recycles beverage bottles. (Round your answer
to 2 decimal places.)
b) Probability that a consumer who lives in a state with a
deposit law does not recycle. (Round your answer to 2 decimal places.)
c) Percentage of consumers who recycle and live in a state with
a deposit law. (Round your answer to 1 decimal place.)
d) Percentage of consumers in states with a deposit law who
recycle. (Round your answer to the nearest whole percent.)
Explanation
(a)
P(Recycles) = 322/1,000 = 0.32
(b)
P(Don’t Recycle | Lives in Deposit Law State) = 67/200 = 0.34.
(c)
P(Recycles and Lives in Deposit Law State) = 133/1,000 =
0.133, or 13.3%.
(d)
P(Recycles | Lives in Deposit Law State) = 133/200 = 0.67, or 67%.
“The probability of rolling three sevens in a row with dice is
.0046.”
Which kind of probability is it?
a) Empirical
b) Classical
c) Subjective
b) Classical
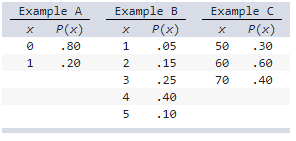
Which of the following could not be probability distributions?
a) None
b) Example A and C
c) Examples B and C
d)
Example A and B
c) Examples B and C
Explanation
Example A is a probability distribution because the sum of
P(x) is 1 (.8 + .2 = 1) and all probabilities are
nonnegative.
Examples B and C are not
probability distributions because the sum of P(x) is
.95 for B and 1.30 for C.
Last year’s freshman class at Big State University totaled 5,331 students. Of those, 1,268 received a merit scholarship to help offset tuition costs their freshman year (although the amount varied per student). The amount a student received was N($3,446, $475). If the cost of full tuition was $4,300 last year, what percentage of students who received a merit scholarship did not receive enough to cover full tuition? (Round your answer to the nearest whole percent.)
Percentage of Students = 96%
Explanation
Find P(X < $4,300) =
P(Z<4,300−3,446475)=P(Z<1.80)P(Z<4,300-3,446475)=P(Z<1.80)
=NORM.S.DIST(1.80,1) = 0.9641. 96% of merit scholarship students will
not receive enough to cover their full tuition.
Alternatively one
could use the Excel function = NORM.DIST(4300,3446,475,1) = 0.9639.
(The difference is due to the rounding of the z score to 1.80.)
Pepsi and Mountain Dew products sponsored a contest giving away a
Lamborghini sports car worth $288,000. The probability of winning from
a single bottle purchase was .00000510.
Find the expected
value. (Round your answer to 4 decimal places.)
Expected Value = $1.4688
Explanation
X is the amount of the “value” of a bottle. X can be either $288,000, the value of the Lamborghini, or $0. To find the expected value multiply each value of X by the associated probability. E(X) = ($288,000)(.00000510) + ($0)(.99999490) = 1.4688.
Student Life Insurance Company wants to offer an insurance plan with a maximum claim amount of $6,700 for dorm students to cover theft of certain items. Past experience suggests that the probability of a maximum claim is .02. What premium should be charged if the company wants to make a profit of $36 per policy? Assume any student who files a claim files for the maximum amount and there is no deductible.
Premium Amount = $170
Explanation
X is the amount of the claim. Assume a student who files a claim will claim the maximum amount of $6,700. The values of X are either $6,700 or $0. Expected payout = E(X) = $6,700(.02) + ($0)(.98) = $134, so company adds $36 and charges $170.
The cabin of a business jet has a cabin height 5 feet 9 inches
high.
If a business traveler’s height is N(5'
10", 2.7"), what percentage of the business travelers will
have to stoop? (Round your answer to 4 decimal places.)
Probability = .6443
Explanation
We want to know the probability of getting a business traveler who
is taller than 5’ 9”. To make it easier, we can convert everything to
inches. Therefore, we should use a mean of 70 inches and a cabin
height of 69 inches.
P(X>69)=1−P(X<69)P(X>69)=1−P(X<69) = 1 −
NORM.DIST(69,70,2.7,1) = .6444. We can also use the standardized
z-score:
z=69 − 702.7=−.37. z=69 − 702.7=−.37.
P(Z < −.37) = .3557. P(Z >
−.37) = 1 − .3557 = .6443.
Use Excel to find each probability. (Round your answers to 4 decimal places.)
a) P(80 < X < 110) for
N(100,15)
b) P(1.50 < X < 2.00)
for N(0,1)
c) P(4,500 < X <
7,000) for N(6000,1000)
d) P(225 <
X < 450) for N(600,100)
Explanation
a.
P(80 < X < 110) = P(X <
110) – P(X < 80) = NORM.DIST(110,100,15,1) −
NORM.DIST(80,100,15,1) = .6563.
b.
P(1.50 < X < 2.00) = P(X
< 2.00) – P(X < 1.50) = NORM.DIST(2,0,1,1) −
NORM.DIST(1.5,0,1,1) = .0441.
c.
P(4500 < X < 7000) = P(X
< 7000) – P(X < 4500) =
NORM.DIST(7000,6000,1000,1) − NORM.DIST(4500,6000,1000,1) = .7745.
d.
P(225 < X < 450) = P(X <
450) – P(X < 225) = NORM.DIST(450,600,100,1) −
NORM.DIST(225,600,100,1) = .0667.
The host of a daily financial radio program stated that in his
opinion, “There is a 25 percent chance that AT&T Wireless and
Verizon will merge.”
What kind of probability is this?
a) Empirical
b) Subjective
c) Classical
b) Subjective
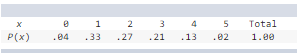
On the midnight shift, the number of patients with head trauma in an emergency room has the probability distribution shown below.
a) Calculate the mean and standard deviation. (Round your mean value to 2 decimal places and standard deviation to 3 decimal places.)
b) Describe the shape of this distribution.
- Skewed to the
right
- Skewed to the left
- Symmetric
Explanation
(a)
Based on the table below we see that: E(X) =
2.12, V(X) = 1.385600, σσ = 1.177.
x
P(x)xP(x)
x−E(X)
P(x)[x−E(X)]2
0 .04 .00 −2.12 .179776 1 .33 .33 −1.12 .413952 2 .27 .54 −.12 .003888
3 .21 .63 .88 .162624 4 .13 .52 1.88 .459472 5 .02 .10 2.88 .165888
Total 1.00 2.12 1.385600
(b)
The distribution is skewed to the right.
Daily output of Marathon's Garyville, Lousiana, refinery is normally distributed with a mean of 232,000 barrels of crude oil per day with a standard deviation of 7,000 barrels.
a) What is the probability of producing at least 232,000 barrels?
(Round your answer to 4 decimal places.)
b) What is the probability of producing between 232,000 and
239,000 barrels? (Round your answer to 4 decimal places.)
c) What is the probability of producing less than 239,000
barrels? (Round your answer to 4 decimal places.)
d) What is the probability of producing less than 245,000
barrels? (Round your answer to 4 decimal places.)
e) What is the probability of producing more than 225,000
barrels? (Round your answer to 4 decimal places.)
Explanation
(a)
P(X > 232,000) = 1 − P(X <
232,000) = 1 − NORM.DIST(232000,232000,7000,1) = 1− .50 = .50. We can
also use the standardized z-score:
z =232,000 − 232,000 = 0.7,000
P(X < 232,000) = P(Z < 0) =
.5 so P(X > 232,000) = 1 − .5 = .5.
(b)
P(X < 239,000) − P(X <
232,000) = NORM.DIST(239000,232000,7000,1) − NORM.DIST
(232000,232000,7000,1) = .8413 − .5 = .3413. We can also use the
standardized z-score:
z =239,000 − 232,000 = 1and z =232,000 − 232,000 =
0.7,0007,000P(232,000 < X < 239,000) =
P(0 < Z < 1), which is .3413 (from Appendix C-1).
(c)
P(X < 239,000) = NORM.DIST(239000,232000,7000,1)
= .8413. We can also use the standardized z-score:
z =239,000 − 232,000 = 1.7,000P(Z < 1) =
.8413 (from Appendix C-2).
(d)
P(X < 245,000) = NORM.DIST(245000,232000,7000,1)
= .9684. We can also use the standardized z-score:
z =245,000 − 232,000 = 1.86.7,000P(Z <
1.86) = .9686 (from Appendix C-2).
(e)
P(X > 225,000) = 1 − P(X <
225,000) = 1 − NORM.DIST(225000,232000,7000,1) = 1 − .1587 = .8413. We
can also use the standardized z-score:
z =225,000 − 232,000 = −1.7,000
1 −
P(Z < −1) = .8413.
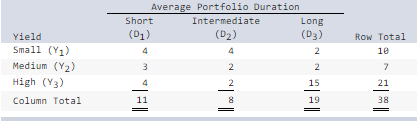
The following contingency table shows average yield (rows) and average duration (columns) for 38 bond funds.
For a randomly chosen bond fund, find the probability of the following: (Round your answers to 4 decimal places.)
a) The bond fund is of long duration.
b) The bond fund has high
yield.
c) The bond fund has high yield given that it is of short
duration.
d) The bond fund is of short duration given that it has
high yield.
Explanation
a. P(D
3) = 19/38 = 0.5000.
b. P (Y
3) = 21/38 = 0.5526.
c. P(Y
3 | D
1) = P(Y
3 ∩∩ D
1)/(D
1) = (4/38)/(11/38) = 0.3636. Another way is 4/11 = 0.3636
because the two 38s cancel each other out.
d. P(D
1 | Y
3) = P(Y
3 ∩∩ D
1)/P(Y
3) = (4/38)/(21/38) = 0.1905. Another way is 4/21 = 0.1905
because the two 38s cancel each other out.
If Punxsutawney Phil sees his shadow on February 2, then legend says
that winter will last 6 more weeks. In 123 years, Phil has seen his
shadow 103 times.
a) What is the probability that Phil
will see his shadow on a randomly chosen Groundhog Day? (Round
your answer to 4 decimal places.)
b) What kind of probability is this?
- Empirical
-
Classical
- Subjective
Explanation
a)
103/123 = 0.8374.
b)
Empirical
The contingency table below shows the results of a survey of video viewing habits by age.
a) Probability that a viewer is aged 18–34.
(Round your answer to 2 decimal places.)
b) Probability that a viewer prefers watching
videos on a TV screen. (Round your answer to 2 decimal
places.)
c) Percentage of viewers who are 18–34 and
prefer videos on a mobile or laptop device.
d) Percentage of viewers given they are 18–34 who
prefer videos on a mobile or laptop device. (Round your answer
to 2 decimal places.)
e) Percentage of viewers who are
35–54 or prefer videos on a mobile or laptop device.

Explanation
(a)
P(A viewer is aged 18−34) = 60/100 = 0.60.
(b)
P(A viewer prefers watching TV videos) = 50/100 = 0.50.
(c)
P (A viewer is aged 18−34 and prefers watching videos on
mobile/laptop device) = 32/100 = 0.32 or 32%.
(d)
In Image
(e)
P(Aged 35−54 ∪∪ mobile/laptop device) =
P(Aged 35−54) + P(mobile/laptop device
) – P(Aged 35−54 ∩∩ mobile/laptop
device) = (0.28 + 0.50) – 0.14 = 0.64 or 64%
Suppose X ~ N(58, 7). Write the Excel function to calculate the following probabilities:
a) P(X<55.1)
b) P(X ≥ 60.6)
c)
P(54.1 ≤ X < 63.4)
a) =NORM.DIST(55.1,58,7,1)
b) =1−NORM.DIST(60.6,58,7,1)
c)
=NORM.DIST(63.4,58,7,1) – NORM.DIST(54.1,58,7,1)
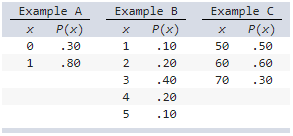
Which of the following could not be probability distributions?
a) Example B and C
b) Example A and B
c) Example A and
C
d) None
c) Example A and C
Explanation
Example B is a probability distribution because the sum of
P(x) is 1 (.1 + .2 + .4 + .2 + .1 1) and all
probabilities are nonnegative.
Example A and C
are not probability distributions because the sum of
P(x) is 1.10 for A and 1.40 for C.
Oxnard Petro Ltd. is buying hurricane insurance for its off-coast oil
drilling platform. During the next five years, the probability of
total loss of only the above-water superstructure ($220 million) is
.30, the probability of total loss of the facility ($920 million) is
.30, and the probability of no loss is .40.
Find the
expected loss. (Input the amount as a positive value.)
Expected Loss = $342 million
Explanation
Let X equal the loss during a hurricane. The values of X are either $220 million, $920 million, or $0. Expected Loss = E(X ) = $220(.30) + $920(.30) + $0(.40) = $342 million.
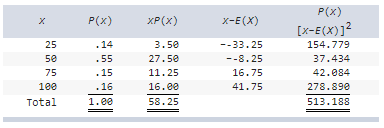
On hot, sunny, summer days, Jane rents inner tubes by the river that runs through her town. Based on her past experience, she has assigned the following probability distribution to the number of tubes she will rent on a randomly selected day.
a) Calculate the expected value and standard deviation of this
random variable X.
b) Describe the shape of this distribution.
Explanation
(a)
Based on the table below we see that: E(X) =
58.25, V(X) = 513.188, σσ = 22.65.
(b)
The distribution is skewed to the right.
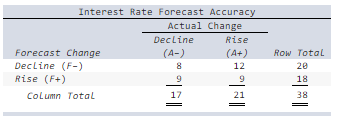
Researchers examined forecasters’ interest rate predictions for 34 quarters to see whether the predictions corresponded to what actually happened. The 2 × 2 contingency table below shows the frequencies of actual and predicted interest rate movements.
Calculate each probability (i–vi): (Round your answers to 4 decimal places.)
Explanation
i. P(F−) = 20/38 = 0.5263. The
probability that the forecasters predicted a decline in interest rates
is 0.5263.
ii. P(A+) = 21/38 = 0.5526. The probability
there was a rise in interest rates is 0.5526.
iii. P(A− | F−) = 8/20 = 0.4000.
Given that the forecasters predicted a decline in interest rates, the
probability that there was an actual decline is 0.4000.
iv. P(A+ | F+) = 9/18 = 0.5000. Given
that the forecasters predicted an increase in interest rates, the
probability that there was an actual increase is 0.5000.
v. P(A+ and F+) = 9/38 = 0.2368. The
probability that in a given year there was both a forecasted increase
and actual increase in interest rates is 0.2368.
vi. P(A− and F−) = 8/38 = 0.2105. The
probability that in a given year there was both a forecasted decline
and actual decline in interest rates is 0.2105.
If the weight (in grams) of cereal in a box of Lucky Charms is N(487,7), what is the probability that the box will contain less than the advertised weight of 457 g? Note: You may need to use Excel to calculate the exact probabilities. (Round your answer to 5 decimal places.)
Probability = .00001
Explanation
P(X < 457) = P(Z < 457 − 4877) = P(Z<−4.29) = .00001.P(X < 457) = P(Z < 457 − 4877) = P(Z<-4.29) = .00001.
Using Excel: NORM.DIST(457,487,7,1) = .00001.
It is
very unlikely that a box will contain less than 457 grams.