Instructions for Side by Side Printing
- Print the notecards
- Fold each page in half along the solid vertical line
- Cut out the notecards by cutting along each horizontal dotted line
- Optional: Glue, tape or staple the ends of each notecard together
General Statistics: Ch 6 HW
front 1 What requirements are necessary for a normal probability distribution to be a standard normal probability distribution? | back 1 The mean and standard deviation have the values of µ = 0 and σ = 1. |
front 2 The waiting times between a subway departure schedule and the arrival of a passenger are uniformly distributed between 0 and 8 minutes. Find the probability that a randomly selected passenger has a waiting time less than 0.75 minutes. | back 2 0.098 P(less than 0.75) = (length of shaded region) x (height of shaded region) = (0.75 – 0) x (1 ÷ 8) *round to 2 dec. places =(0.75) x (0.13) = 0.0975 |
front 3 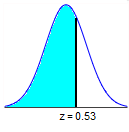 Find the area of the shaded region. The graph depicts the standard normal distribution with mean 0 and standard deviation 1. | back 3 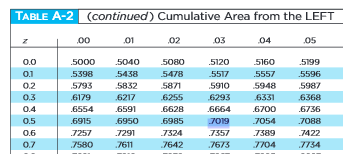 The area of the shaded region is 0.7019. |
front 4 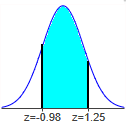 Find the area of the shaded region. The graph depicts the standard normal distribution of bone density scores with mean 0 and standard deviation 1. | back 4 The area of the shaded region is 0.7309. Area = (0.8944 – 0.1635) |
front 5 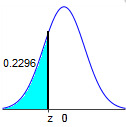 Find the indicated z score. The graph depicts the standard normal distribution with mean 0 and standard deviation 1. | back 5 The indicated z score is -0.74. |
front 6 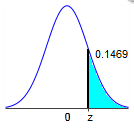 Find the indicated z score. The graph depicts the standard normal distribution with mean 0 and standard deviation 1. | back 6 The indicated z score is 1.05.
Symmetric to Area of 0.1469 (z score of -1.05) OR Area = 1 – 0.1469 |
front 7 Assume that a randomly selected subject is given a bone density test. Those test scores are normally distributed with a mean of 0 and a standard deviation of 1. Find the probability that a given score is less than 1.66 and draw a sketch of the region. | back 7 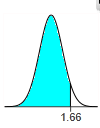 The probability is 0.9515. |
front 8 Assume the readings on thermometers are normally distributed with a mean of 0°C and a standard deviation of 1.00°C. Find the probability that a randomly selected thermometer reads greater than –1.78 and draw a sketch of the region. | back 8 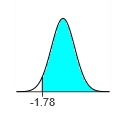 The probability is 0.9625.
Symmetric to z-score of 1.78 (Area = 0.9625) OR 1 – 0.0375 |
front 9 Assume the readings on thermometers are normally distributed with a mean of 0°C and a standard deviation of 1.00°C. Find the probability that a randomly selected thermometer reads between –1.03 and –0.02 and draw a sketch of the region. | back 9 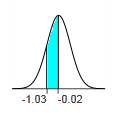 The probability is 0.3405. Area = (0.4920 – 0.1515) |
front 10 Assume that a randomly selected subject is given a bone density test. Those test scores are normally distributed with a mean of 0 and a standard deviation of 1. Find the probability that a given score is between –2.02 and 3.84 and draw a sketch of the region. | back 10 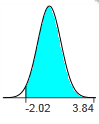 The probability is 0.9782. * For values of z above 3.48, use 0.9999 Area = (0.9999 – 0.0217) |
front 11 Assume that the readings on the thermometers are normally distributed with a mean of 0° and standard deviation of 1.00°C. A thermometer is randomly selected and tested. Draw a sketch and find the temperature reading corresponding to P97, the 97th percentile. This is the temperature reading separating the bottom 97% from the top 3%. | back 11 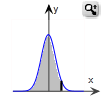 The temperature for P97 is approximately 1.88 °.
Area of 0.9700 ≈ 0.9699 (z score of 1.88) |
front 12 Assume that the readings on the thermometers are normally distributed with a mean of 0° and standard deviation of 1.00°C. Assume 2.1% of the thermometers are rejected because they have readings that are too high and another 2.1% are rejected because they have readings that are too low. Draw a sketch and find the two readings that are cutoff values separating the rejected thermometers from the others. | back 12 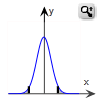 The cutoff values are –2.03, 2.03 degrees. Area values nearest 0.021 and 0.979 ≈ 0.0212 and 0.9788 |
front 13 Find the indicated area under the curve of the standard normal distribution, then convert it to a percentage and fill in the blank. | back 13 About 72.86% of the area is between z = –1.1 and z = 1.1 (or within 1.1 standard deviations of the mean). |
front 14 Which of the following groups of terms can be used interchangeably when working with normal distributions? | back 14 areas, probability, and relative frequencies Area, probability, percentages, and relative frequencies are all used interchangeably when working with normal distributions. |
front 15 Which of the following is NOT a requirement for a density curve? | back 15 The graph is centered around 0. "The graph is centered around 0" is not a requirement for a density curve. |
front 16 Which of the following does NOT describe the standard normal distribution? | back 16 The graph is uniform. The standard normal distribution is not uniform because its graph is bell-shaped. |
front 17 Which of the following would be information in a question asking you to find the area of a region under the standard normal curve as a solution? | back 17 A distance on the horizontal axis is given When given a z-score, you are usually finding the area of the shaded region under the standard normal curve. For the standard normal curve, a z-score is a distance along the horizontal axis. |
front 18 Assume that a randomly selected subject is given a bone density test. Those test scores are normally distributed with a mean of 0 and a standard deviation of 1. Find the probability that a given score is less than 3.61 and draw a sketch of the region. | back 18 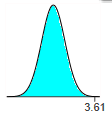 The probability is 0.9999. |
front 19 Assume that a randomly selected subject is given a bone density test. Bone density test scores are normally distributed with a mean of 0 and a standard deviation of 1. Draw a graph and find P3, the 3rd percentile. This is the bone density score separating the bottom 3% from the top 97%. | back 19 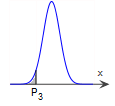 The bone density score corresponding to Upper P 3 is –1.88. Area = 0.0300 ≈ 0.0301 |
front 20 Find the indicated critical value. z0.04 | back 20 z0.04 = 1.75
Area = 0.0400 ≈ 0.0401 |
front 21 A survey found that women's heights are normally distributed with mean 63.6 in and standard deviation 2.3 in. A branch of the military requires women's heights to be between 58 in and 80 in.
| back 21 a. The percentage of women who meet the height requirement is 99.25%. *(58 – 63.6) ÷ 2.3 = -2.43 (min) *(80 – 63.6) ÷ 2.3 = 7.13 (max) P(-2.43 < z < 7.13) = (1.0000 – 0.0075) = 0.9925 No, because only a small percentage of women are not allowed to join this branch of the military because of their height. b. For the new height requirements, this branch of the military requires women's heights to be at least 58.2 in and at most 68.3 in. *shortest 1% = 0.0100 ≈ 0.0099 (value of -2.33) *tallest 2% = 0.9800 ≈ 0.9798 (value of 2.05) *µ + (x × σ) 63.6 + (-2.33 × 2.3) = 58.241 63.6 + (2.05 × 2.3) = 68.315 |
front 22 Men's heights are normally distributed with mean 68.7 in and standard deviation of 2.8 in. Women's heights are normally distributed with mean 63.5 in and standard deviation of 2.5 in. The standard doorway height is 80 in.
| back 22 a. The percentage of men who are too tall to fit through a standard door without bending is 0%. *(80 – 68.7) ÷ 2.8 = 4.035714286 ≈ 4.04 P(z > 4.04) = 1 – P(z < 4.04) = 1 – 0.9999 = 0.0001 = 0% The percentage of women who are too tall to fit through a standard door without bending is 0%. *(80 – 63.5) ÷ 2.5 = 6.6 P(z > 6.60) = 1 – P(z < 6.60) = 1 – 0.9999 = 0.0001 = 0% b. The statistician would design a house with doorway height 73.3 in. *tallest 5% = 0.9500 ≈ 1.645 µ + (x × σ) 68.7 + (1.645 × 2.8) = 73.306 |
front 23 The lengths of pregnancies are normally distributed with a mean of 266 days and a standard deviation of 15 days.
| back 23 a. The probability that a pregnancy will last 307 days or longer is 0.0032. *(307 – 266) ÷ 15 = 2.7333333 (z score) P(z > 2.73) = 1 – P(z < 2.73) = 1 – 0.9977 = 0.0032 b. Babies who are born on or before 235 days are considered premature. *lowest 2% = 0.0200 ≈ 0.0202 = -2.05 µ + (x × σ) 266 + (-2.05 × 15) = 235.25 |
front 24 Assume that the Richter scale magnitudes of earthquakes are normally distributed with a mean of 1.087 and a standard deviation of 0.562.
| back 24 a. 94.74% *(2.00 – 1.087) ÷ 0.562 = 1.62455516 P(z < 1.62) = 0.9474 b. 0% *(4.00 – 1.087) ÷ 0.562 = 5.183274021 P(z > 5.18) = 1 – P(z < 5.18) = 1 – 0.9999 = 0.0001 c. 2.011 *95th = 0.9500 = 1.645 (z score) µ + (x × σ) 1.087 + (1.645 × 0.562) = 2.01149 d. No, because not all earthquakes above the 95th percentile have magnitudes above 4.0. |
front 25 Chocolate chip cookies have a distribution that is approximately normal with a mean of 23.1 chocolate chips per cookie and a standard deviation of 2.6 chocolate chips per cookie. Find P5 and P95. How might those values be helpful to the producer of the chocolate chip cookies? | back 25 P5 = 18.8 *P5 = 0.0500 = -1.645 (z score) µ + (x × σ) 23.1 + (-1.645 × 2.6) = 18.823 P95 = 27.4 *95th = 0.9500 = 1.645 (z score) µ + (x × σ) 23.1 + (1.645 × 2.6) = 27.377 The values can be used to identify cookies with an unusually low or high number of chocolate chips, so those numbers can be used to monitor the production process to ensure that the numbers of chocolate chips stays within reasonable limits. |
front 26 Pulse rates of women are normally distributed with a mean of 77.5 beats per minute and a standard deviation of 11.6 beats per minute. What are the values of the mean and standard deviation after converting all pulse rates of women to z scores using z = (x – µ) ÷ σ? The original pulse rates are measure with units of "beats per minute". What are the units of the corresponding z scores? | back 26 µ = 0 σ = 1 The z scores are numbers without units of measurement. |
front 27 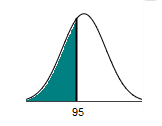 Find the area of the shaded region. The graph to the right depicts IQ scores of adults, and those scores are normally distributed with a mean of 100 and a standard deviation of 15. | back 27 The area of the shaded region is 0.3707. *z = (95 – 100) ÷ 15 = -0.333 P(z < -0.33) = 0.3707 |
front 28 Assume that adults have IQ scores that are normally distributed with a mean of µ = 100 and a standard deviation σ = 15. Find the probability that a randomly selected adult has an IQ less than 118. | back 28 The probability that a randomly selected adult has an IQ less than 118 is 0.8849. *z = (118 – 100) ÷ 15 = 1.2 P(z < 1.20) = 0.8849 |
front 29 Assume that adults have IQ scores that are normally distributed with a mean of 100 and a standard deviation 15. Find P3, which is the IQ score separating the bottom 3% from the top 97%. | back 29 The IQ score that separates the bottom 10% from the top 90% is P3 = 71.8. *bottom 3% = 0.0300 ≈ 0.0301 (z score = -1.88) µ + (x × σ) 100 + (-1.88 × 15) = 71.8 |
front 30 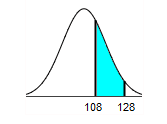 Find the area of the shaded region. The graph to the right depicts IQ scores of adults, and those scores are normally distributed with a mean of 100 and a standard deviation of 15. | back 30 The area of the shaded region is 0.2674. *z1 = (108 – 100) ÷ 15 = 0.533 *z2 = (128 – 100) ÷ 15 = 1.867 P(0.53 < z < 1.87) = 0.9693 – 0.7019 = 0.2674 |
front 31 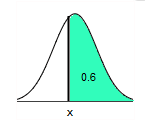 Find the indicated IQ score. The graph to the right depicts IQ scores of adults, and those scores are normally distributed with a mean of 100 and a standard deviation of 15. | back 31 The indicated IQ score, x, is 96.3. *1 – 0.6 = 0.4 ≈ 0.4013 (z score = -0.25) µ + (x × σ) = 100 + (-0.25 × 15) = 96.25 |
front 32 Which of the following is not true?
| back 32 A z-score is an area under the normal curve. A z-score is not an area under the normal curve. Distances along the horizontal axis are represented by z-scores, while regions under the curve are represented by areas. |
front 33 What conditions would produce a negative z-score? | back 33 a z-score corresponding to an area located entirely in the left side of the curve A z-score corresponding to an area located entirely in the left side of the curve would produce a negative z-score. |
front 34 Which of the following statistics are unbiased estimators of population parameters?
| back 34 Sample proportion used to estimate a population proportion. Sample variance used to estimate a population variance. Sample mean used to estimate a population mean. Sample means, sample proportions, and sample variances are unbiased estimators of population parameters. That is, their sampling distributions have a mean that is equal to the mean of the corresponding population parameter. |
front 35 The assets (in billions of dollars) of the four wealthiest people in a particular country are 37, 27, 22, 19. Assume that samples of size n = 2 are randomly selected with replacement from this population of four values.
| back 35 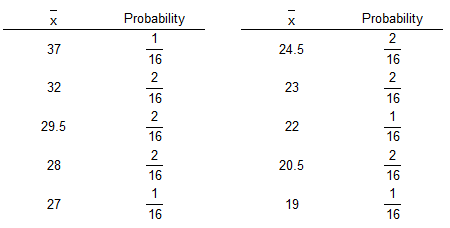 a. (see picture) 37-37; 37-27; 37-22; 37-19; 27-37; 27-27; 27-22; 27-19; 22-37; 22-27; 22-22; 22-19; 19-37; 19-27; 19-22; 19-19 – (16 samples) The distinct means are 37, 32, 29.5, 28, 27, 24.5, 23, 22, 20.5, and 19. To find the corresponding probability for each mean, divide the number of occurrences of that mean by the total number of samples. b. The mean of the population, 26.25, is equal to the mean of the sample means, 26.25. Recall that the mean of a set of data is the measure of center found by adding the data values and dividing the total by the number of data values. (37, 27, 22, 19) ÷ 4 = 26.25 c. The sample means target the population mean. In general, sample means do make good estimates of population means because the mean is an unbiased estimator. |
front 36 Which of the following is NOT a property of the sampling distribution of the sample mean?
| back 36 The distribution of the sample mean tends to be skewed to the right or left. This is not a property of the sampling distribution. The distribution of the sample means tends to be a normal distribution. |
front 37 Which of the following is a biased estimator? That is, which of the following does not target the population parameter? | back 37 Median The median is a biased estimator. It does not target the population parameter. |
front 38 The population of current statistics students has ages with mean µ and standard deviation σ. Samples of statistics students are randomly selected so that there are exactly 37 students in each sample. For each sample, the mean age is computed. What does the central limit theorem tell us about the distribution of those mean ages? | back 38 Because n > 30, the sampling distribution of the mean ages can be approximated by a normal distribution with mean µ and standard deviation σ ÷ √(37) . The central limit theory applies whenever n > 30. Because n > 30, the sampling distribution of the mean ages can be approximated by a normal distribution with mean µ and standard deviation σ ÷ √(n) . |
front 39 Which of the following is NOT a conclusion of the Central Limit Theorem?
| back 39 The distribution of the sample data will approach a normal distribution as the sample size increases. The Central Limit Theorem applies to the sampling distribution of x̄ and not to the distribution of the sample data. |
front 40 Which of the following is not a commonly used practice?
| back 40 If the distribution of the sample means is normally distributed, and n > 30, then the population distribution is normally distributed. This is not always the case because skewed population distributions may have sampling distributions that are normally distributed. |
front 41 Assume that women's heights are normally distributed with a mean given by µ = 63.6 in, and a standard deviation given by σ = 2.6 in. (a) If 1 woman is randomly selected, find the probability that her height is less than 64 in. (b) If 44 women are randomly selected, find the probability that they have a mean height less than 64 in. | back 41 (a) The probability is approximately 0.5596. (64 – 63.6) ÷ 2.6 = 0.1538461538 ≈ 0.15 Area to the left of z = 0.15 is approximately 0.5596 (b) The probability is approximately 0.8461. σx̄ = σ ÷ √(n) = 2.6 ÷ √(44) ≈ 0.391964748 z ≈ (64 – 63.6) ÷ 0.391964748 ≈ 1.020499935 ≈ 1.02 Area to the left of z = 1.02 is approximately 0.8461 |
front 42 Assume that women's heights are normally distributed with a mean given by µ = 62.2 in, and a standard deviation given by σ = 2.8 in.
| back 42 a. The probability is approximately 0.1420. zlow = (62.0 – 62.2) ÷ 2.8 = -0.0714285714 ≈ -0.07 zup = (63.0 – 62.2) ÷ 2.8 = 0.2857142857 ≈ 0.29 The probability is the area between zlow = -0.07 and zup = 0.29 under the standard normal distribution. Area = 0.6141 – 0.4721 = 0.1420 b. The probability is approximately 0.4768. σx̄ = σ ÷ √(n) = 2.8 ÷ √(15) ≈ 0.7229568913 zlow = (62.0 – 62.2) ÷ 0.7229568913 ≈ -0.2766416676 ≈ -0.28 zup ≈ (63.0 – 62.2) ÷ 0.47229568913 ≈ 1.10656667 ≈ 1.11 The probability is the area between z = -0.28 and z = 1.11 under the standard normal distribution. 0.8665 – 0.3897 = 0.4768 |
front 43 Women have head circumferences that are normally distributed with a mean given by µ = 24.27 in., and a standard deviation given by σ = 0.8 in.
| back 43 a. The probability is 0.4586. zlow = (23.6.0 – 24.27) ÷ 0.8 ≈ -0.84 zup = (24.6 – 24.27) ÷ 0.8 ≈ 0.41 The probability is the area between zlow = -0.84 and zup = 0.41 under the standard normal distribution. Area = 0.6591 – 0.2005 = 0.4586 b. The minimum head circumference accommodated should be 22.48 in. The maximum head circumference accommodated should be 26.06 in. smallest 1.25% = 0.0125 --> z = -2.24 largest 1.25% = 0.9875 --> z = 2.24 min = (-2.24)(0.8) + 24.27 = 22.478 max = (2.24)(0.8) + 24.27 = 26.062 c. The probability is 0.9217. σx̄ = σ ÷ √(n) = 0.8 ÷ √(12) ≈ 0.2309401077 zlow = (23.6 – 24.27) ÷ 0.2309401077 ≈ -2.90 zup ≈ (24.6 – 24.27) ÷ 0.2309401077 ≈ 1.43 The probability is the area between z = -2.90 and z = 1.43 under the standard normal distribution. 0.9236 – 0.0019 = 0.9217 d. No, the hats must fit individual women, not the mean from 12 women. If all hats are made to fit head circumferences between 23.6 in. and 24.6 in., the hats won't fit about half of those women. |
front 44 A ski gondola carries skiers to the top of a mountain. It bears a plaque stating that the maximum capacity is 12 people or 1920 lb. That capacity will be exceeded if 12 people have weights with a mean greater than (1920 lb)/12 = 160 lb. Assume that weights of passengers are normally distributed with a mean of 177.5 lb and a standard deviation of 40.4 lb.
| back 44 a. 0.6664 z = (160 – 177.5) ÷ 40.4 = -0.43 The cumulative area is 0.3336 Subtract this probability from 1 to find the probability that the passenger's weight is greater than 160 lb. 1 – 0.3336 = 0.6664 b. 0.9332 z = (x̄ – µ) ÷ (σ / √(n) ) = (160 – 177.5) ÷ (40.4 / √(12) ) = -1.50 The cumulative area is 0.0668 Subtract this probability from 1 to find the probability that the sample mean is greater than 160 lb. 1 – 0.0668 = 0.9332 c. No, there is a high probability that the gondola will be overloaded if it is occupied by 12 passengers, so it appears that the number of allowed passengers should be reduced. The gondola will be overloaded if the mean weight of the passengers is above the maximum allowed mean weight. |
front 45 An engineer is going to redesign an ejection seat for an airplane. The seat was designed for pilots weighing between 150 lb and 191 lb. The new population of pilots has normally distributed weights with a mean of 156 lb and a standard deviation of 25.7 lb.
| back 45 a. The probability is approximately 0.5041. zlow = (150 – 156) ÷ 25.7 ≈ -0.23 zup = (191 – 156) ÷ 25.7 ≈ 1.36 The probability is the area between zlow = -0.23 and zup = 1.36 under the standard normal distribution. Area = 0.9131 – 0.4090 = 0.5041 b. The probability is approximately 0.9098. σx̄ = σ ÷ √(n) = 25.7 ÷ √(33) ≈ 4.473795758 zlow = (150 – 156) ÷ 4.473795758 ≈ -1.34 zup ≈ (191 – 156) ÷ 4.473795758 ≈ 7.82 The probability is the area between z = -1.34 and z = 7.82 under the standard normal distribution. 0.9999 – 0.0901 = 0.9098 c. Part (a) because the seat performance for a single pilot is more important. |
front 46 An airliner carries 200 passengers and has doors with a height of 72 in. Heights of men are normally distributed with a mean of 69.0 in and a standard deviation of 2.8 in.
| back 46 a. The probability is 0.8577. z = (72 – 69.0) ÷ 2.8 = 1.07 The cumulative area is 0.8577 b. The probability is 0.9999. z = (x̄ – µ) ÷ (σ / √(n) ) = (72 – 69.0) ÷ (2.8 / √(100) ) = 10.71 The cumulative area is 0.9999 c. The probability from part (a) is more relevant because it shows the proportion of male passengers that will not need to bend. d. Since men are generally taller than women, a design that accommodates a suitable proportion of men will necessarily accommodate a greater proportion of women. |
front 47 Before every flight, the pilot must verify that the total weight of the load is less than the maximum allowable load for the aircraft. The aircraft can carry 35 passengers, and a flight has fuel and baggage that allows for a total passenger load of 5,880 lb. The pilot sees that the plane is full and all passengers are men. The aircraft will be overloaded if the mean weight of the passengers is greater than (5,880 lb)/35 = 168 lb. What is the probability that the aircraft is overloaded? Should the pilot take any action to correct for an overloaded aircraft? Assume that weights of men are normally distributed with a mean of 175.5 lb and a standard deviation of 38.7. | back 47 The probability is approximately 0.8749. σx̄ = σ ÷ √(n) = 38.7 ÷ √(35) ≈ 6.541493932 z = (168 – 175.5) ÷ 6.541493932 ≈ -1.15 The cumulative area is 0.1251 Subtract this area from 1 to find the area to the right. 1 – 0.1251 = 0.8749 Yes. Because the probability is high, the pilot should take action by somehow reducing the weight of the aircraft. |
front 48 The value given below is discrete. Use the continuity correction and describe the region of the normal distribution that corresponds to the indicated probability. Probability of exactly 5 passengers who do not show up for a flight | back 48 The area between 4.5 and 5.5 |
front 49 If np ≥ 5 and nq ≥ 5, estimate P(more than 5) with n = 12 and p = 0.4 by using the normal distribution as an approximation to the binomial distribution; if np < 5 or nq < 5, then state that the normal approximation is not suitable. | back 49 The normal distribution cannot be used.
np = (12)(0.4) = 4.8 < 5 |
front 50 If np ≥ 5 and nq ≥ 5, estimate P(more than 5) with n = 13 and p = 0.6 by using the normal distribution as an approximation to the binomial distribution; if np < 5 or nq < 5, then state that the normal approximation is not suitable. | back 50 P(at least 8) = 0.567
µ = np =
(13)(0.6) = 7.8 σ = √(npq) = √(13×0.6×0.4) = 1.766352173 z = (x – 0.5 – µ) ÷ σ = (8 – 0.5 – 7.8) ÷ 1.766352 = -0.17 Area = 0.4325 P(at least 8) = 1 – P(less than 8) = 1 – 0.433 = 0.567 |
front 51 A scientist conducted a hybridization experiment using peas with green pods and yellow pods. He crossed peas in such a way that 25% (or 144) of the 576 offspring peas were expected to have yellow pods. Instead of getting 144 peas with yellow pods, he obtained 149. Assume that the rate of 25% is correct.
| back 51 a. The probability that exactly 149 have yellow pods is 0.0355. b. The probability that at least 149 have yellow pods is 0.3336. c. Part (b) is useful for determining whether the claimed rate is incorrect. d. No |
front 52 A gender-selection technique is designed to increase the likelihood that a baby will be a girl. In the results of the gender-selection technique, 809 births consisted of 422 baby girls and 387 baby boys. In analyzing these results, assume that boys and girls are equally likely.
| back 52 a. The probability of getting exactly 422 girls in 809 births is 0.0131. b. The probability of getting 422 or more girls in 809 births is 0.1151. c. No, because 422 girls in 809 births is not far from what is expected, given the probability of having a girl or a boy. d. No, because the probability of having 422 or more girls in 809 births is not punlikely, and thus, is attributable to random chance. |
front 53 In a survey of 1227 people, 828 people said they voted in a recent presidential election. Voting records show that 65% of eligible voters actually did vote. Given that 65% of eligible voters actually did vote.
| back 53 (a) P(X ≥ 828) = 0.0359 (b) Some people are being less than honest because P(x ≥ 828) is less than 5%. |
front 54 Based on a recent survey, 20% of adults in a specific country smoke. In a survey of 100 students, it is found that 18 of them smoke. Find the probability that should be used for determining whether the 20% rate is correct for students. What can be concluded? | back 54 The probability that should be used for determining whether the 20% rate is correct is 0.352. There is not very strong evidence against the 20% rate because this probability is not very small. |
front 55 Which of the following is NOT a requirement for using the normal distribution as an approximation to the binomial distribution?
| back 55 The sample is the result of conducting several dependent trials of an experiment in which the probability of success is p. Having the sample as the result of conducting several dependent trials of an experiment in which the probability of success is p is not a requirement for using the normal distribution as an approximation to the binomial distribution. |
front 56 Which statement below indicates the area to the left of 19.5 before a continuity correction is used?
| back 56 At most 19 "At most 19" indicates the area to the left of 19.5 before a continuity correction is used. |
front 57 A continuity correction is made to a discrete whole number x in the binomial distribution by representing the discrete whole number x by which of the following intervals? | back 57 x – 0.5 to x + 0.5 The interval is x–0.5 to x+0.5 because 0.5 needs to be added and subtracted from x to create the interval. |