Instructions for Side by Side Printing
- Print the notecards
- Fold each page in half along the solid vertical line
- Cut out the notecards by cutting along each horizontal dotted line
- Optional: Glue, tape or staple the ends of each notecard together
Chapter 1 Introduction
front 1 Ultrasound | back 1 Sound or other vibrations having an ultrasonic frequency, particularly as used in medical imaging. |
front 2 Sonography | back 2 Medical anatomic imaging employing ultrasound. Comes from the latin word sonus (sound) and the Greek word graphein (to write). Diagnostic Sonography is medical 2D and 3D anatomic and flow imaging using ultrasound. |
front 3 Doppler Ultrasound | back 3 Detection, quantization, and evaluation of tissue motion and blood flow using the Doppler Effect with ultrasound. |
front 4 Doppler Effect | back 4 A change in frequencies caused by moving objects. Echoes produced by moving objects have frequencies that are different from the pulses sent in to the body. This is put to use in detecting and measuring tissue motion and blood flow. |
front 5 Image | back 5 Is a reproduction, representation or imitation of the physical form of a person or object. An ultrasound image is a visible counterpart of an invisible object, produced in an electrical instrument by the interaction of ultrasound and an object. |
front 6 Pulse-echo technique | back 6 Pulses of ultrasound are generated by a transducer and are sent into the patient, where they produce echoes at organ at organ boundaries and within tissue. These echoes then return to the transducer where they are detected and then presented on the display. |
front 7 Transducer | back 7 Generates the ultrasound pulses and receives the returning echoes. |
front 8 Gray-scale image | back 8 A series of spot of different intensities, creating an ultrasound image. |
front 9 Scan line | back 9 One line of echo information |
front 10 Linear image | back 10 Pulses travel in the same direction, even though they start from different points, and yield vertical parallel scan lines and a rectangular image. |
front 11 Sector image | back 11 Each pulse is originates from the same starting point, but subsequent pulses go out in slightly different directions. This creates an image shaped like a piece of pie. |
front 12 Color-Doppler display | back 12 Rapid scanning and processing of Doppler data enable color-coded 2D and 3D presentations of Doppler information, super-imposed on a gray-scale image. |
front 13 Spectral-Doppler | back 13 measurement and a visual record are made of the shift in frequency of a continuous ultrasonic wave proportional to the blood-flow velocity in underlying vessels; used in diagnosis of vascular disease. It is also used in detection of the fetal heartbeat or of the velocity of movement of a structure, such as the beating heart. |
front 14 The diagnostic ultrasound imaging (sonography) method has two parts:
| back 14 D) pulses, ultrasound, echoes, image |
front 15 Ultrasound gray-scale scans are ________________ - ____________ images of tissue cross-sections and volumes.
| back 15 A) pulse - echo |
front 16 The brightness of an echo, as presented on the display, represents the ______________ of echo.
| back 16 A) strength |
front 17 A linear scan is composed of many __________, __________ scan lines.
| back 17 C) vertical, parallel |
front 18 A sector scan is composed of many scan lines with a common _______________.
| back 18 C) origin |
front 19 A linear scan has a ______________ shape.
| back 19 D) rectangle |
front 20 A sector scan is shaped like a _________ of _________.
| back 20 A) slice, pie |
front 21 A sector scan can have a(n) ____________ or a ___________ top.
| back 21 B) pointed, curved |
front 22 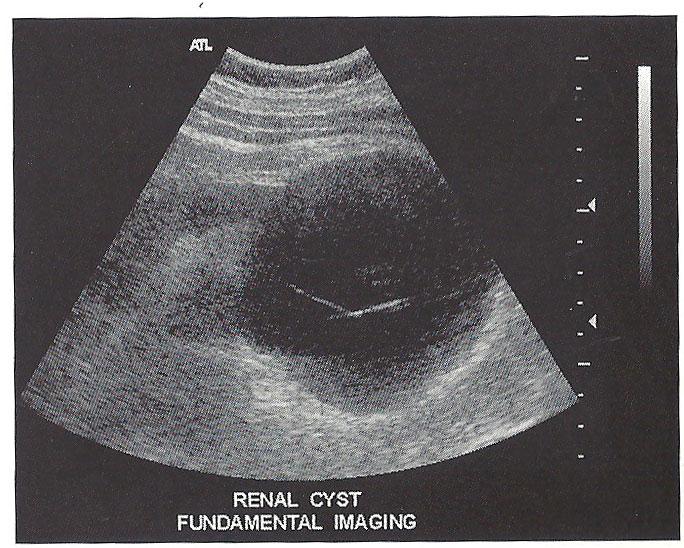 an example of an image in which the scan lines do not originate at a common ______________.
| back 22 C) origin |
front 23 Sonography is accomplished by using a pulse-echo technique. The information of importance in doing this includes the ___________ from which each echo originates and the ____________ of each echo. From this information, the instrument can determine the echo _______________, and ____________ on the display.
| back 23 A) location, strength, location, brightness |
front 24 The ___________ is the interface between the patient and the instrument.
| back 24 C) transducer |
front 25 Transducers generate ultrasound __________ and receive returning ________________.
| back 25 A) pulses, echo |
front 26 Three-dimensional echo information is presented on ________________ displays.
| back 26 B) 2D |
front 27 Acquisition of a 3D echo data volume requires scanning the ultrasound through several tissue __________.
| back 27 D) cross-sections |
front 28 The Doppler effect is a change in echo ___________.
| back 28 D) frequency |
front 29 The change in the frequency of doppler effect is due to ________________.
| back 29 B) motion |
front 30 The motion that produces the Doppler effect is that of the ___________.
| back 30 D) reflector |
front 31 In medical applications, the flow of _______________ is commonly the source of the Doppler effect. Doppler information is applied to ___________ for audible evaluation and to _________ for visual analysis.
| back 31 D) blood, loudspeakers, displays |
front 32 The visual display of Doppler information can be in the form of a ____________-Doppler display or a ___________-Doppler display.
| back 32 A) spectral, color |
front 33 Color-Doppler displays can present Doppler-__________ and Doppler-_____________ information in color.
| back 33 C) shift, power |
front 34 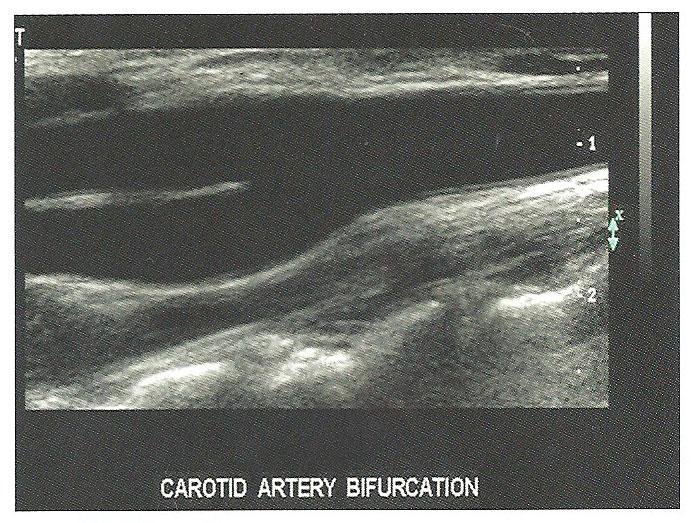 A) 2D linear image
| back 34 A) 2D linear image |
front 35 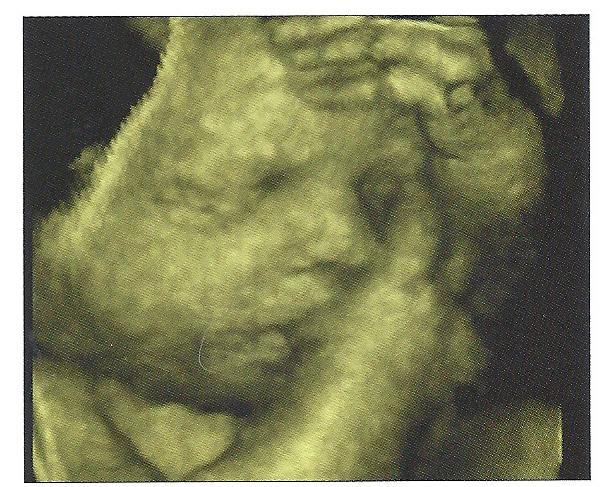 A) 2D linear image
| back 35 D) 3D gray-scale image |
front 36  A) 2D linear image
| back 36 E) spectral display |
front 37 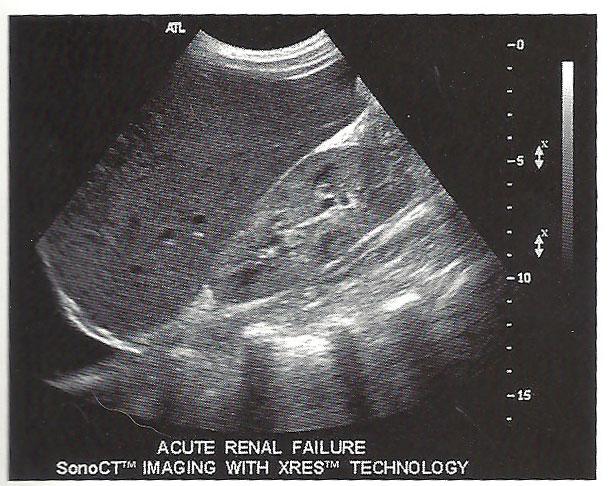 A) 2D linear image
| back 37 C) modified sector image |
front 38  A) 2D linear image
| back 38 B) 2D sector image |