Instructions for Side by Side Printing
- Print the notecards
- Fold each page in half along the solid vertical line
- Cut out the notecards by cutting along each horizontal dotted line
- Optional: Glue, tape or staple the ends of each notecard together
Ecology lab final
front 1 Define ecology | back 1 the study of the complex interactions |
front 2 Define naturalists | back 2 individuals who dedicate their time and efforts to studying and
becoming experts on |
front 3 What is the difference between a null and alternative hypothesis? | back 3 Null= there is no difference or correlation between what you are testing. Alternative hypothesis= The expected difference or correlation does exist |
front 4 What information should be included in field note entries? (4 major components) | back 4 identification (to species when |
front 5 Our provided flowchart broke the scientific method into 5 major steps. What are they? | back 5 Information, question, hypothesis, prediction, test of hypothesis (observational study, experiment, modelling) |
front 6 Define standard deviation | back 6 how far away from the mean the individual measurements tend to fall in a sample |
front 7 Define quadrat | back 7 A plot that is laid down on the surface being studied to define a standard sampling area |
front 8 List some important qualities for a naturalist to possess as they set about describing the natural history of an organism. | back 8 attention to detail, awareness pf surroundings, focus, an open mind, illustration skills |
front 9 Based on the process of the scientific method, do observations of
natural history alone provide | back 9 No, hypotheses must go through the scientific method |
front 10 Why are preserved animals important for study? (3) | back 10 They can be used to increase identification accuracy, to prepare a voucher collection, to keep repositories of genetic material for study and conservation purposes, etc |
front 11 What are the three field sampling techniques? | back 11 Line transect, mark-recapture, quadrat |
front 12 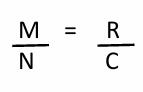 What are the variables in this equation? | back 12 M=marked upon first capture N=population R=Recaptured from the first round C=total captured in second round |
front 13 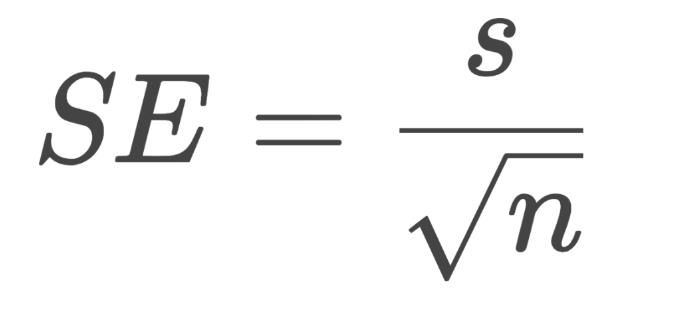 What are the variables in this equation? | back 13 SE=standard error s=standard deviation n=sample size |
front 14 What is pseudo-replication? | back 14 When your sample size is artificially inflated because you took measurements that are not independent from each other (ex. measured the same cherry multiple times, measured cherries from only one tree). |
front 15 How do you avoid bias in your measurements? | back 15 By taking randomized samples. |
front 16 What are the two types of "error" in measurements? | back 16 Bias and random variation |
front 17 What does standard error help you quantify? | back 17 How confident you should be in you estimate of the population mean. |
front 18 What are the 4 categories of measurements/data? | back 18 Nominal, ordinal, interval, ratio |
front 19 What is nominal data? | back 19 Values without quantitative (a measure number) value. Normally categories that are names. |
front 20 What is ordinal data? | back 20 Categories that can be ranked according to some criteria. ex. height, size, weight... |
front 21 What are the three types of functional responses? | back 21 Type I - linear relationship, predator eats prey in direct proportion to abundance, no handling time Type II - prey consumed initially rises with abundance but levels off with further increase Type III - Type II but initially prey consumed does not quicky increase with abundance (an S ish shape) |
front 22 What is ratio data? | back 22 Quantitative values where the scale has a true, physically meaningful, zero (ex. area, height, weight, Kelvin) |
front 23 What is the difference between discrete and continuous data? | back 23 Discrete data has only certain possible values while continuous data can have any value. |
front 24 What are the 4 ways we can evaluate distribution? | back 24 Geographical range, abundance, dispersal, survival and reproduction |
front 25 What statistical analysis will you use if you are looking for... a correlation that is parametric, where the X variable is independent of Y | back 25 Linear regression |
front 26 What statistical analysis will you use if you are looking for... a difference in variances | back 26 F-test |
front 27 What statistical analysis will you use if you are looking for... a difference in central tendencies that are parametric, where there are 2 treatments which are not paired | back 27 t-test |
front 28 What statistical analysis will you use if you are looking for... a difference in central tendencies that are parametric, where there are more than 2 treatments | back 28 ANOVA |
front 29 What is a hypothesis? | back 29 An educated guess to answer a question which can be experimentally supported or not. |
front 30 What is the difference between a null and alternative hypothesis? | back 30 Null= there is no difference is there is no difference or correlation between what you are testing. Alternative hypothesis= The expected difference or correlation does exist |
front 31 Why is the null and alternative hypothesis set up good for statistical analyses? | back 31 Because it allows us to find the probability that the null hypothesis is false, which supports our alternative hypothesis. |
front 32 What are the 4 sources of phenotypic variation within a species? | back 32 Tolerance, acclimation, developmental responses, ecotypes. |
front 33 What information should be included in field note entries? (4 major components) | back 33 identification (to species when |
front 34 What is the meaning of a p-value? | back 34 The probability of getting the same results through random chance (which is why you want it to be small). |
front 35 What are the 4 main elements of the introduction of a research paper? | back 35 Background information, research problem, thesis statement/research question, rational and significance |
front 36 What are the two types of ecological study? Give a pro and a con for each. | back 36 Observational (natural)- pros: interacting variables, cheaper, more realistic, cons: less control over variables Experiment (manipulative)- pros: more control over variables, manipulate the variables, cons: more expensive, less realistic, |
front 37 Define controls. | back 37 A treatment in which the independent variable(s) is/are not being manipulated. |
front 38 Define controlled variables. | back 38 Variables which you are manually manipulating in an experiment. |
front 39 What is nominal data? | back 39 Values without quantitative (a measure number) value. Normally categories that are names. |
front 40 What do rank abundance distributions show? | back 40 The relative abundance of species in a community in descending order (common to rare). |
front 41 Define the predictions of a hypothesis. | back 41 The results that we would expect to see (in a particular experiment) if the hypothesis is true. |
front 42 Define marginal value theorem/MTV (as it pertains to foraging). | back 42 An animal will stop foraging in a patch when the rate of energy gain drops below the average rate of energy gain in the habitat. |
front 43 Define functional response. | back 43 The changes in prey consumption vs prey density |
front 44 What are the three types of functional responses? | back 44 Type I - linear relationship, predator eats prey in direct proportion to abundance, no handling time Type II - prey consumed initially rises with abundance but levels off with further increase Type III - Type II but initially prey consumed does not quicky increase with abundance (an S ish shape) |
front 45 What does Holling's disc equation describe? | back 45 Describes the realationship between search time, handling time, and consumption ate in type II functional responses |
front 46 What are the variables in the Holling's disc equation? define them. | back 46 Pe - number of prey eaten Th - handling time per prey item Ts - total search time Ttot - total time spent a' - attack rate / search efficiency N - prey density |
front 47 Define competition. | back 47 When organisms both do worse when together than when apart. |
front 48 Define interference competition. | back 48 When the mechanisms for competition are direct and physical (such as interfering with another organisms resource collection via hoarding). |
front 49 Define exploitation competition. | back 49 When one organism completely makes a resource unavailable to another organism (one ant species blocking off entrances to another nest). |
front 50 intraspecific competition, interspecific competition, which is between different species? | back 50 Interspecific competition |
front 51 What does Holling's disc equation describe? | back 51 Describes the relationship between search time, handling time, and consumption rate in type II functional responses |
front 52 What does Pielou's evenness index measure? | back 52 The evenness of a community. |
front 53 What do rank abundance distributions show? | back 53 The relative abundance of species in a community in descending order (common to rare). |
front 54 What do species accumulation curves show? | back 54 The cumulative number of species recorded (y-axis) verses the number of individuals sampled. |
front 55 Define marginal value theorem/MTV (as it pertains to foraging). | back 55 An animal will stop foraging in a patch when the rate of energy gain drops below the average rate of energy gain in the habitat. |
front 56 How do you transform your Shannon's diversity index value into a Pielou's evennesss index value? | back 56 You divide it by ln(S) or ln(species richness) Note: species richness is number species in the community |
front 57 Why are soil microorganisms important? | back 57 They help break down organic matter and make nutrients available to other organisms. |
front 58 What are the 4 components of soil? | back 58 Minerals, decaying organic matter, air pockets and water |
front 59 How do the feeding activities of macroinvertebrates accelerate the process of decomposition? | back 59 By physically breaking down organic material into smaller fragments which are more accessible to soil microbes. |
front 60 How does macroinvertebrate burrowing allow microbes to penetrate deeper into the soil? | back 60 By creating channels. |