Instructions for Side by Side Printing
- Print the notecards
- Fold each page in half along the solid vertical line
- Cut out the notecards by cutting along each horizontal dotted line
- Optional: Glue, tape or staple the ends of each notecard together
Ecology chapter 14
front 1 What's the differences between mesopredators and top predators? | back 1 Only consume herbivores vs consuming herbivores and other predators. |
front 2 Explain how removal of top predators can cause an increase in the distribution and abundance of mesopredators. | back 2
|
front 3 Explain how grazing can lead to higher diversity of the plant community that is being grazed. | back 3 By reducing the biomass of certain species others have more space to grow. |
front 4 Describe one factor that allows predators and prey to coexist and explain how it allows coexistence. | back 4
|
front 5 What is the purpose of the Lotka-Volterra model? | back 5 to explain mathematically why and how |
front 6 Link corresponding regions on the Lotka-Volterra population trajectory graph and a graph showing prey and predator population cycles over time. | back 6 no data |
front 7 What is a functional response? Give an example. | back 7 The relationship between the density of prey and an individual predator’s rate of food consumption. Ex. [enter ex. here] |
front 8 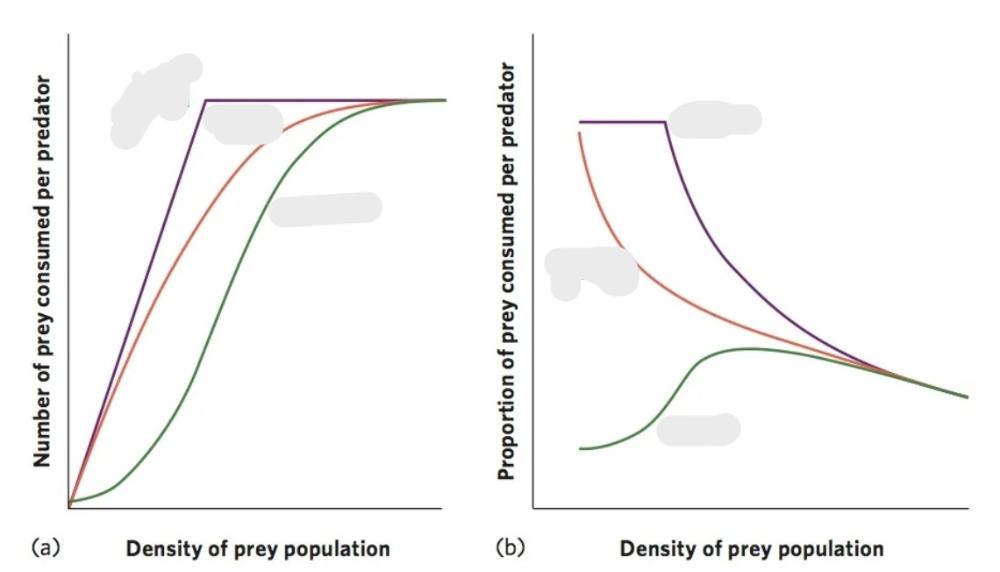 Which colour of line is which type of functional response? What causes the shapes? | back 8 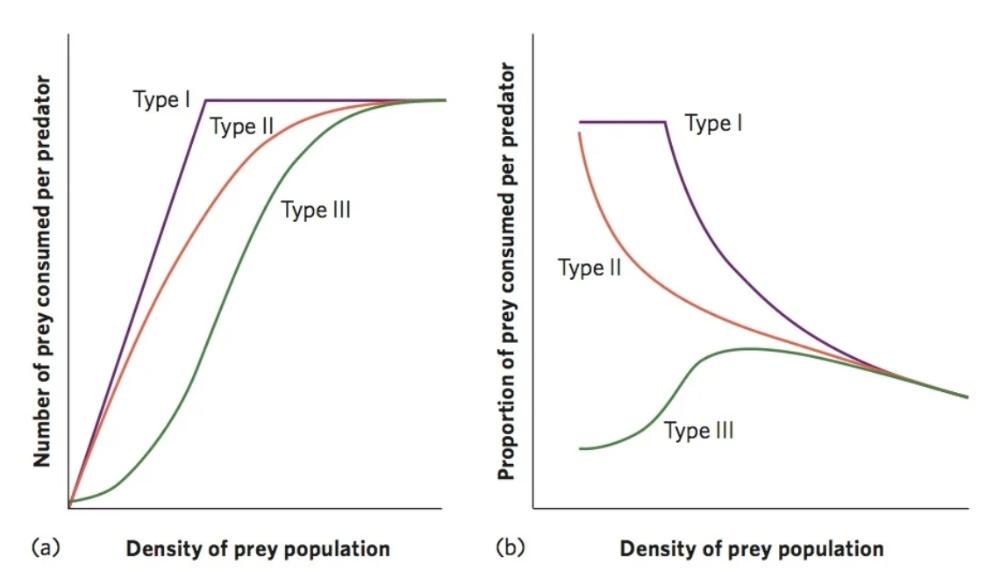 Purple= type 1, increases in prey density result in an ever-increasing number of prey consumed by a predator until the predator becomes satiated and can consume no additional prey. Orange = type 2, the number of prey consumed slows because as predators consume more prey, they must spend more time handling the prey. Green = type 3, as prey density increases there is an initial increase in the proportion of prey consumed. However, as the predators spend more time handling prey and become satiated, this proportion subsequently declines. |
front 9 Differentiate between functional response and numerical response | back 9 Prey density and an individual predator's rate of consumption vs the change in predator population through population growth or population movement. |
front 10 Give a structural example of defense against predation or herbivory. | back 10
|
front 11 Give a chemical example of defense against predation or herbivory. | back 11
|
front 12 Give a behavioural example of defense against predation or herbivory. | back 12
|