Instructions for Side by Side Printing
- Print the notecards
- Fold each page in half along the solid vertical line
- Cut out the notecards by cutting along each horizontal dotted line
- Optional: Glue, tape or staple the ends of each notecard together
BMD 315 Module 4 Study Guide/Learning Objectives
front 1 Define Pharmacodynamics | back 1 the branch of pharmacology concerned with the effects of drugs and the mechanism of their action |
front 2 Define law of mass action | back 2 The rate of a chemical reaction is directly proportional to the concentrations of the reactants. In Other Words:
|
front 3 What is a dissociation constant? | back 3 The dissociation constant (Kd) measures how tightly a ligand (like a drug) binds to a target (like a receptor or enzyme). Kd is the concentration of a ligand at which half of the target sites are occupied. |
front 4 What are the three assumptions that must be made to have a ligand binding and physiological effect of a drug? | back 4 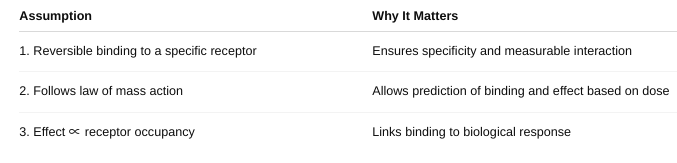 |
front 5 How does Affinity relate to the dissociation constant? | back 5 If a drug has a low Kd, it binds well — meaning it has high affinity for its target. |
front 6 Draw a Ligand Binding Curve. Label axes and constants. Be able to explain. (figure 2-1) | back 6 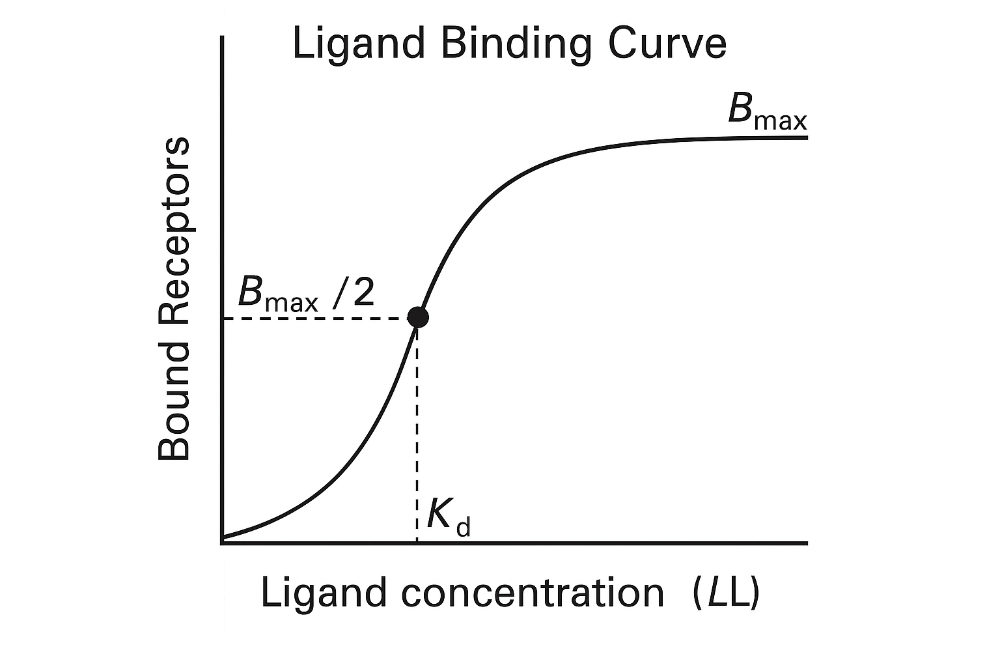 Key point: 1. **At low ligand concentrations**: 2. **At Kd**: 3. **At high concentrations**: |
front 7 The Graded Dose Response Curve | back 7 Shows the magnitude of a response in a single individual (or a tissue/cell) as the dose increases.
Key Features: Continuous curve – smooth increase in response with increasing dose. Measures intensity of effect.
|
front 8 The Quantal Dose-Response Curve | back 8 Shows the percentage of a population that shows a defined response at each dose.
Key Features: All-or-none responses — either the effect occurs or doesn’t (e.g., sleep, death). Measures frequency of response across a population.
|
front 9 What are the differences? (figure 2-2, figure 2-3) | back 9 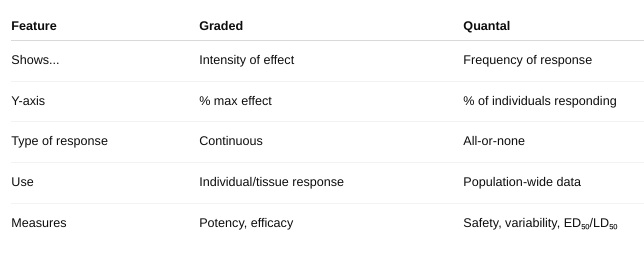 |
front 10 What are the constants you can gather from these curves? | back 10 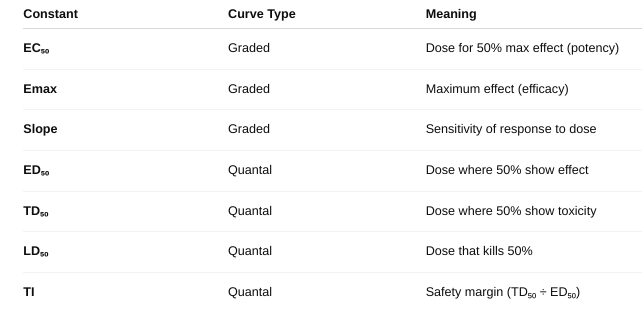 |
front 11 What is efficacy? potency? | back 11 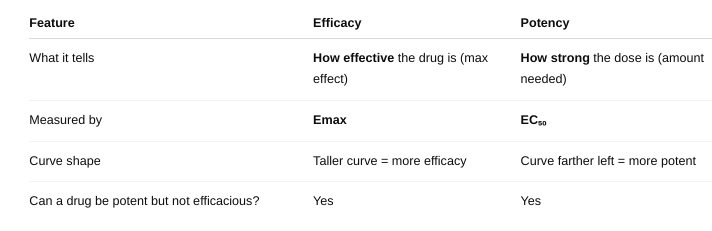 |
front 12 Identify/explain the types of Antagonists. give example. (figure 2-4, figure 2-6, figure 2-7) | back 12 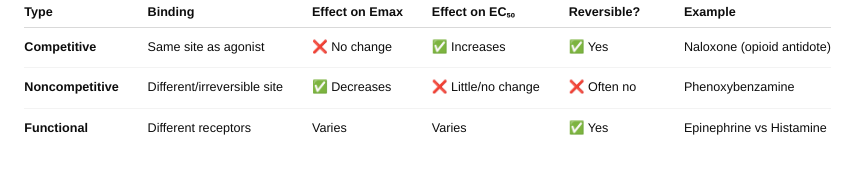 |
front 13 What is a spare receptor? What is its effect on competitive and non-competitive antagonist? (figure 2-8, figure 2-9, table 2-1) | back 13 a receptor that does not need to be occupied for a drug to produce maximum effect. Competitive Antagonist With spare receptors, the system can tolerate receptor blockage and still achieve Emax — because not all receptors need to be occupied. So, competitive antagonists just shift the dose-response curve to the right (increase EC₅₀), but Emax is unchanged.
Noncompetitive Antagonist Normally, noncompetitive antagonists reduce Emax (since their block can’t be reversed). BUT — if there are spare receptors, the drug can still achieve Emax despite some receptors being blocked. So: Low doses of noncompetitive antagonists may not affect Emax if spare receptors are present. Only at higher doses, when too many receptors are blocked, will Emax decrease. |
front 14 What are possible mechanisms for spare receptor effect? | back 14 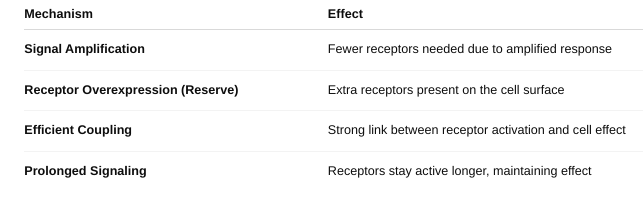 |
front 15 Define each principle of ADME. | back 15 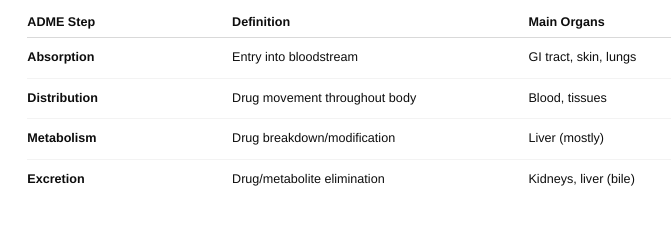 |
front 16 What role do Biological Membranes play in ADME? | back 16 Absorption: Membranes determine whether a drug can enter the bloodstream. Oral drugs must pass through intestinal epithelial membranes. Only lipophilic, non-ionized, and small molecules can easily diffuse. Others require carrier proteins or active transporters. Distribution: Membranes control where the drug goes in the body. Drugs must cross capillary membranes and cell membranes to enter tissues. The blood-brain barrier is a special tight membrane that protects the brain and restricts drug entry. Protein binding in plasma can also affect distribution across membranes. Metabolism: Membranes regulate entry of drugs into metabolic organs and cells (especially liver cells). Drugs must enter hepatocytes (liver cells) through membranes for enzyme processing. Membranes inside the liver cell compartmentalize enzymes (e.g., in the smooth ER for CYP450). Excretion: Membranes are involved in drug removal, especially in kidneys and liver. In the kidney, drugs cross membranes in nephrons (filtration and secretion). In the liver, drugs/metabolites can be secreted into bile via transporters. Transport proteins can pump drugs out of cells for elimination. |
front 17 o Define FLUX. | back 17 the rate of movement of a drug (or any molecule) across a biological membrane. |
front 18 o Define pH trapping | back 18 the process where a drug becomes ionized in a compartment with a different pH, causing it to get “trapped” and unable to cross membranes easily. |
front 19 o Define weak acid and weak base? o Where would a Weak Acid best absorb? Where would a Weak Base best Absorb? | back 19 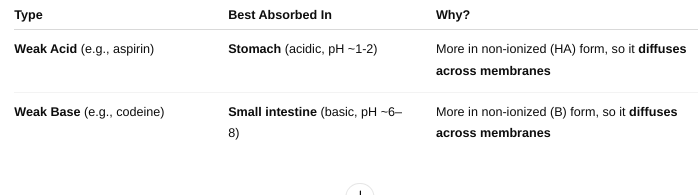 A weak acid is a molecule that partially donates protons (H⁺) in solution. A weak base is a molecule that partially accepts protons (H⁺) in solution. |
front 20 • Define bioavailability. | back 20 the fraction (or percentage) of an administered drug that reaches the systemic circulation in its active form. |
front 21 • Does this change given the route of administration? Why or why not? | back 21 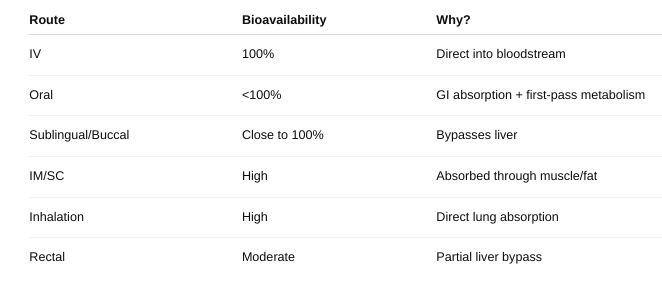 |
front 22 • How do you measure bioavailability? | back 22 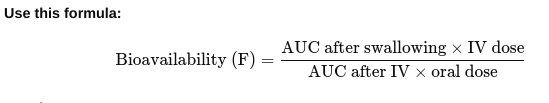 Give the drug two ways: Once directly into the vein (IV) — this is 100% bioavailable. Once by another way (like swallowing it).
Result: If F = 1 (or 100%), all the swallowed drug got into the blood. If less than 1, some drug was lost during absorption or metabolism. |
front 23 • What is first pass metabolism | back 23 when a drug taken by mouth is partially broken down by the liver (and sometimes the gut wall) before it reaches the bloodstream. |
front 24 • What are the pros/cons of the different types of route of administration? (Table 3-1 and Table 3-2) | back 24 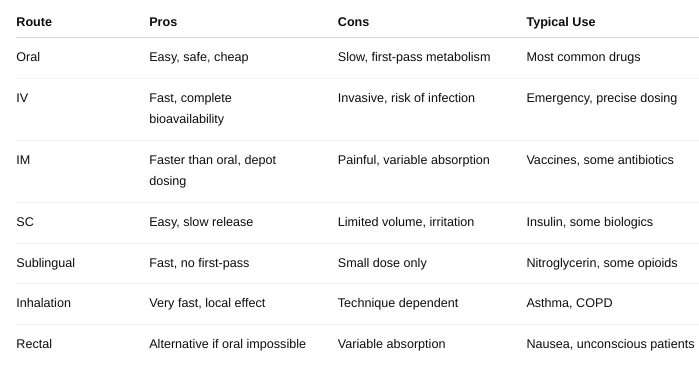 |
front 25 What role does FLUX play in absorption? • What role does pH trapping play in absorption? • What role do drug transporters play in absorption? | back 25 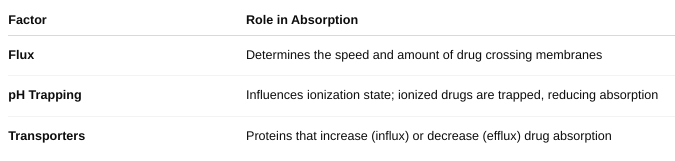 |
front 26 • Define APPARENT Volume of Distribution | back 26 a theoretical volume that relates the amount of drug in the body to the concentration of drug in the blood or plasma. It tells you how extensively a drug distributes into body tissues compared to the blood. |
front 27 • What effect does plasma protein binding have on distribution? | back 27 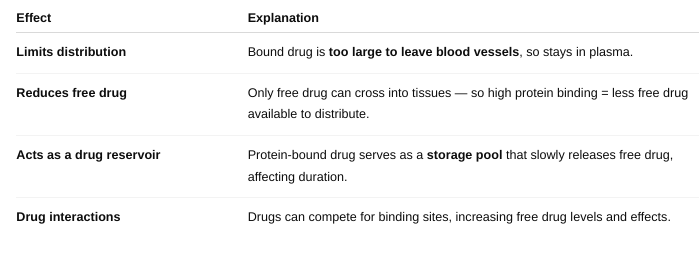 |
front 28 • What reactions are included in Phase I reactions? • What reactions are included in Phase II reactions? | back 28 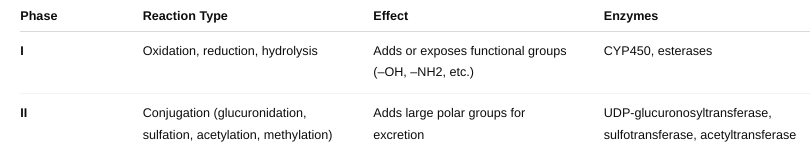 |
front 29 • What is the point of bio-transformations? | back 29 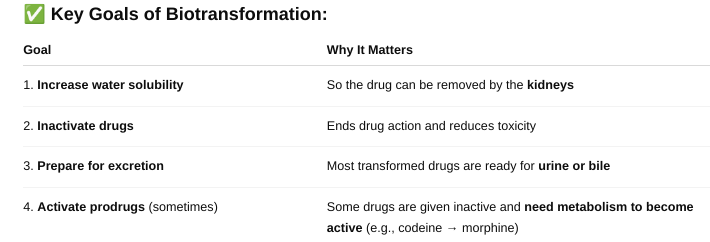 Biotransformation is the process by which the body chemically modifies drugs (and other foreign substances) to make them easier to eliminate |
front 30 • Elimination Kinetics | back 30 describe how the body removes a drug over time — mainly through metabolism (liver) and excretion (kidneys). |
front 31 o Define Half-life (t1/2) | back 31 the time it takes for the concentration of a drug in the blood to decrease by 50%. If you have 100 mg of drug in your body and the half-life is 2 hours, then:
|
front 32 How many half-lives does it typically take to eliminate a drug, typically? | back 32 It typically takes about 4 to 5 half-lives to eliminate a drug from the body. By 4–5 half-lives, over 95% of the drug is gone, which is generally enough for it to be considered "eliminated" for clinical purposes. |
front 33 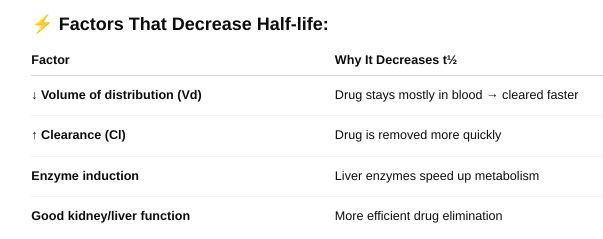 What types of factors affect half-life? (Table 3-5) | back 33 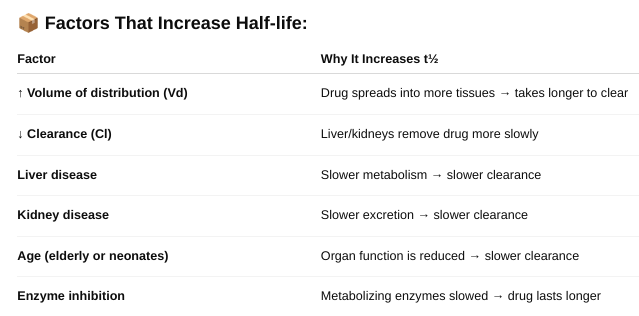 |
front 34 o Define zero and first order kinetics. | back 34 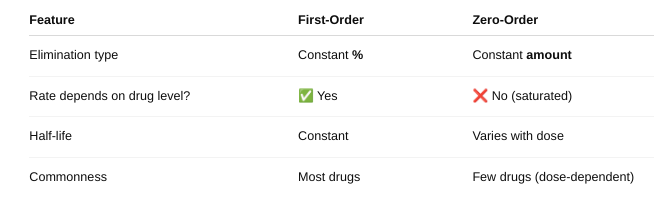 |
front 35 Explain the differences in the rate of elimination. | back 35 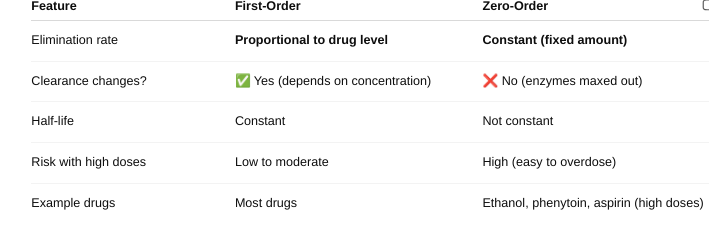 |
front 36 Explain the differences in the half-life. | back 36 First Order Kinetics: Half-life is constant — it stays the same no matter the drug dose.
Zero-Order Kinetics: Half-life is NOT constant — it changes with the drug dose.
|
front 37 When do saturation kinetics apply? | back 37 Saturation kinetics apply when... ✔ Drug concentration is high ✔ Metabolism or transport is saturated ✔ Body can't keep up with elimination ✔ Drug follows zero-order kinetics |
front 38 • Define Clearance and Rate of Elimination | back 38 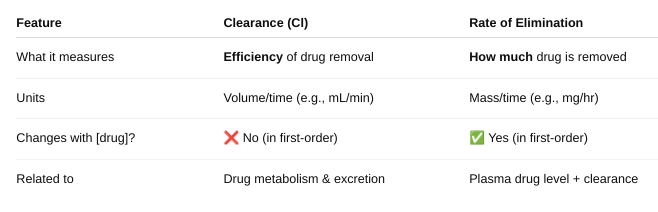 |
front 39 • Figure 3-11. What do the toxic, therapeutic and sub-therapeutic ranges mean on these graphs? o Why do you see “peaks and troughs” instead of a smooth line? | back 39 Therapeutic Range: The drug concentration range where the medication is effective without causing harm. Within this range, the drug produces the desired therapeutic effect. Staying within this range is the goal of dosing. Toxic Range: Drug concentrations above the therapeutic range. At these levels, the drug may cause adverse or toxic effects. Avoiding concentrations in this range helps prevent side effects or overdose. Sub-Therapeutic Range: Drug concentrations below the therapeutic range. The drug level is too low to produce the desired effect. Doses or frequency may need adjustment to reach therapeutic levels. Why Do You See “Peaks and Troughs” Instead of a Smooth Line? When a drug is given in doses at intervals (e.g., every 8 hours), drug levels rise after each dose (peak) and then fall as the drug is eliminated (trough).This causes a sawtooth pattern rather than a smooth curve.
|
front 40 • What is the difference between a loading and maintenance dose? | back 40 Loading Dose Purpose: Quickly raise the drug concentration in the blood to the therapeutic range. When used: For drugs with long half-lives where reaching steady state with regular dosing would take too long. How it works: A larger initial dose is given to “load” the body with drug rapidly. Effect: Achieves desired drug levels quickly, before starting maintenance dosing. Maintenance Dose Purpose: Keep the drug concentration within the therapeutic range over time. When used: After loading dose (or from the start if no loading dose needed). How it works: Smaller doses given at regular intervals to replace the drug eliminated by the body. Effect: Maintains steady-state drug concentration. |
front 41 What are you taking into consideration when calculating dosages? | back 41 Patient Factors Age: Children and elderly often need dose adjustments due to differences in metabolism and clearance. Weight/Body Surface Area: Dosages often scale with body size, especially in pediatrics. Organ function: Liver and kidney function affect drug metabolism and elimination. Disease state: Conditions like heart failure or liver disease can change drug distribution and clearance. Genetics: Some people metabolize drugs faster or slower (pharmacogenetics). Pharmacokinetic Parameters Clearance (Cl): Rate at which the drug is removed from the body. Volume of Distribution (Vd): How extensively the drug distributes into tissues. Half-life (t½): How long the drug stays in the body. Bioavailability (F): Fraction of the dose that reaches systemic circulation (especially important for oral dosing). Drug Factors Therapeutic range: The drug concentration that is effective but not toxic. Route of administration: Affects bioavailability and onset of action. Formulation: Immediate vs. extended-release affects dosing frequency. Dosing Goals Loading dose: To quickly reach therapeutic levels. Maintenance dose: To maintain steady-state levels. Dose interval: How often to give the drug based on half-life. Drug Interactions Some drugs increase or decrease metabolism or clearance of other drugs. |