Instructions for Side by Side Printing
- Print the notecards
- Fold each page in half along the solid vertical line
- Cut out the notecards by cutting along each horizontal dotted line
- Optional: Glue, tape or staple the ends of each notecard together
CHM214 Exam 1
front 1 How is research performed? | back 1 1) Formulate a question 2) Research (see what's been done before) 3) Selecting analytical procedure: - use gold standard method: a tried and true practice that you will use. good validity. 4) sampling - composition sampling--> map out the area - matrix: anything in your sample that is not your analyte - sampling is really important!! - Ex: like making blood last longer via a dilution. Super sensitive to changes in concentration. 5) sample preparation - get the analyze of interest separated - Separation from the matrix (can take a long time) |
front 2 Chemical Analysis | back 2 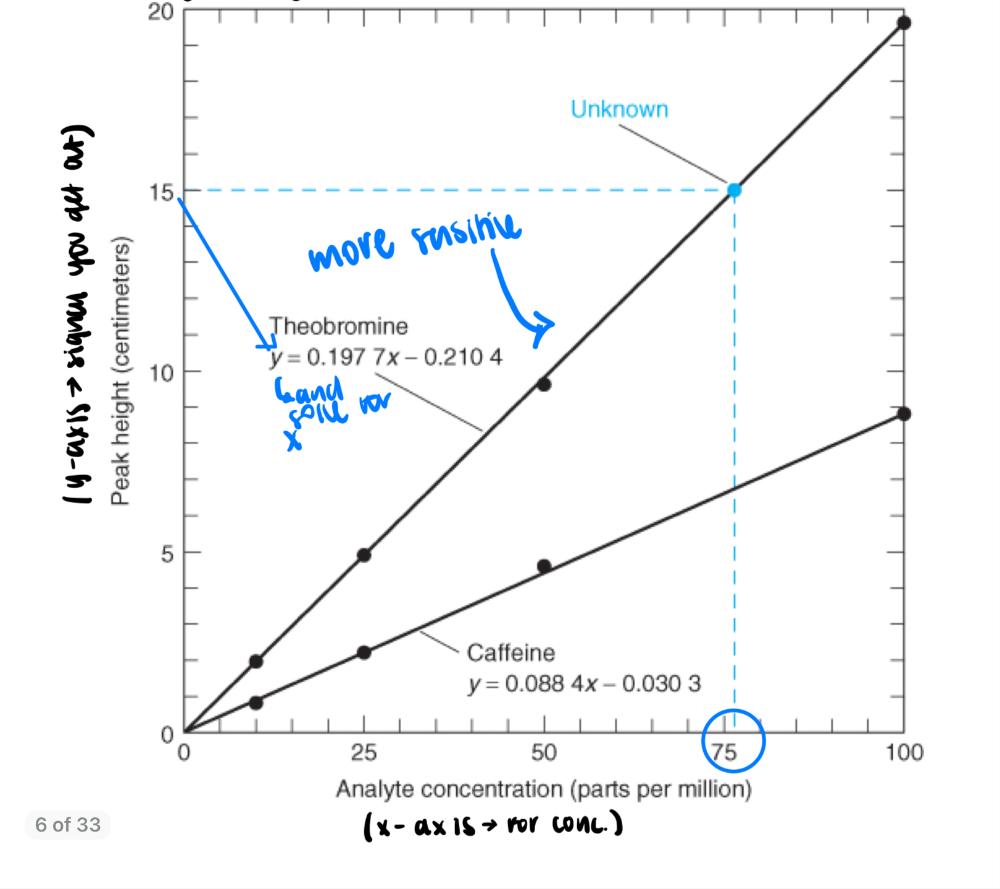 - make a calibration plot - use standards (look for straight lines) --> make your own standard of known concentration - calibration: creating standard of known concentrations and analyzing them in the same way as your analyte. - instrumentation is really important especially with troubleshooting. - replicate analysis: run at least 3 --> because cost effecting to do only 3 Ex: |
front 3 Molarity | back 3 moles solute / L solution |
front 4 Molality | back 4 moles solute/ kg solvent |
front 5 ppm units | back 5 In terms of volume: mg/L or μ/mL. If speaking in terms of mass, μg/g. |
front 6 pub unites | back 6 In terms of volume: μg/L. In terms of mass, ng/g |
front 7 How to calibrate glassware? | back 7 note: always introducing error to calibrate: use water because density (temp. dependent) --> mass out how much water it takes to calibrate out a flask. Then do this 3 times. Weigh it out . always use a volumetric flask |
front 8 Pipets | back 8 1) transfer pipet, only measures single sample. More accurate less error the line is already calibrated. 2) Measuring pipet, want values that aren't always set. 3) Micropipet, for really small volumes. Stable aqueous solutions. Many organic solvents (not chloroform(. Not resistant to concentrated HNO3 or H2SO4. |
front 9 Repition | back 9 try to do at least 3 replicates. Tell us about precision. Try your method and see how accurate your results are to the gold standard method. |
front 10 How do you know if your technique is reliable? Accurate? | back 10 Accuracy: how close our value is to the true value. Test this by using a secondary technique "the gold standard". Test this by making external standards Absolute error = |Xi - Xt| Relative error = |Xi - Xt| / Xt x 100% . Want relative error less than 10% |
front 11 Experimental Error | back 11 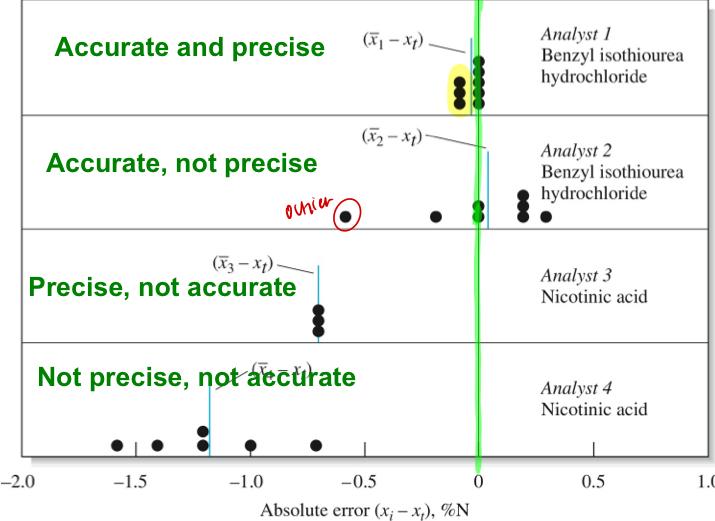 |
front 12 Types of Errors | back 12 - Random error: arrises from uncontrolled and uncontrollable variables in your measurement. Equal chance of being positive or negative. --> effects greatly precision --> Ex: reading a buret/scale indifferent noise, electrical fluctuations in your instrument, vibrations of drafts, environmental effects based on location or proximity or temp. - Systematic error: affects accuracy. Arises rom flaws in your equipment in experimental design. Reproducible error. Constant (same absolute error but relative error changes with sample size. --> proportional error (absolute error changes with sample size but relative error is constant). --> How to check for accuracy? 1 . use a different analytical method 2. use a certified standard 3. run a blank (-) control, or run (+) control |
front 13 How to reduce random error? | back 13 - physical thing to protect your sample (like casing around balance) - more replicates (increase sample size) - average data |
front 14 Sig Figs for Logs | back 14 The number of figures in the mantissa (number of digits after decimal point in logarithm) should equal the number of significant figures in the quantity. |
front 15 Propagation of Uncertainties for Random Errors: Addition or Subtraction | back 15 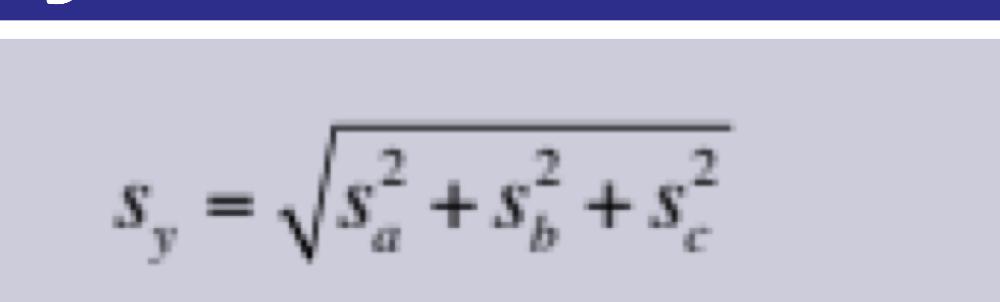 |
front 16 Propagation of Uncertainties for Random Errors: Multiplication or Division | back 16 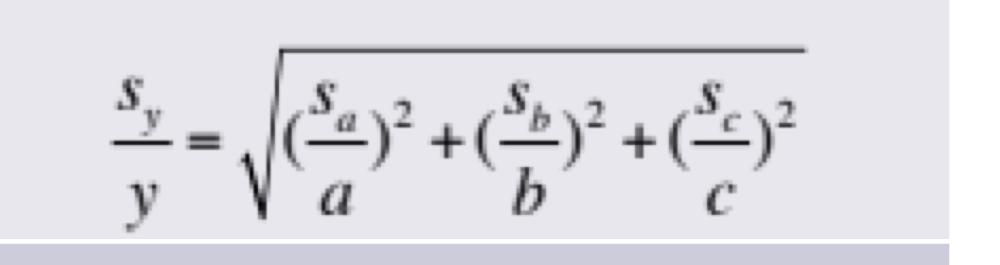 |
front 17 Propagation of Uncertainties for Random Errors: Exponentiation | back 17 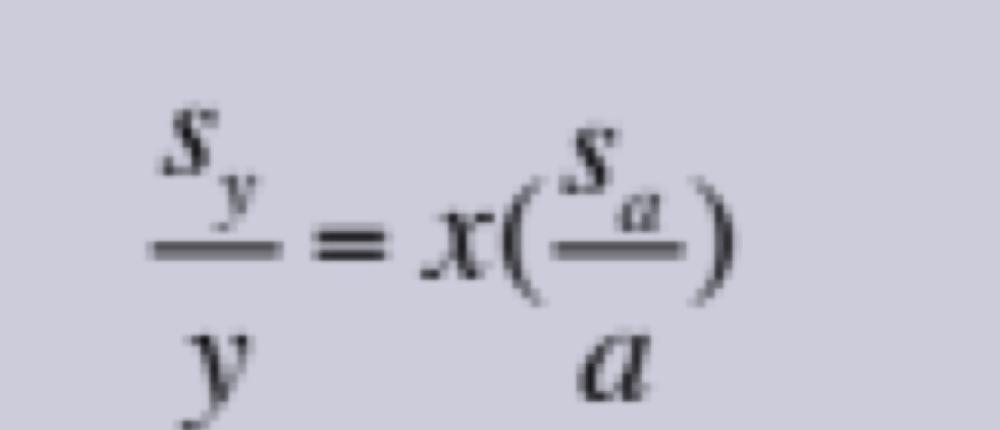 |
front 18 Propagation of Uncertainties for Random Errors: Logarithm | back 18  to find pH |
front 19 Propagation of Uncertainties for Random Errors: Antilogarithm | back 19 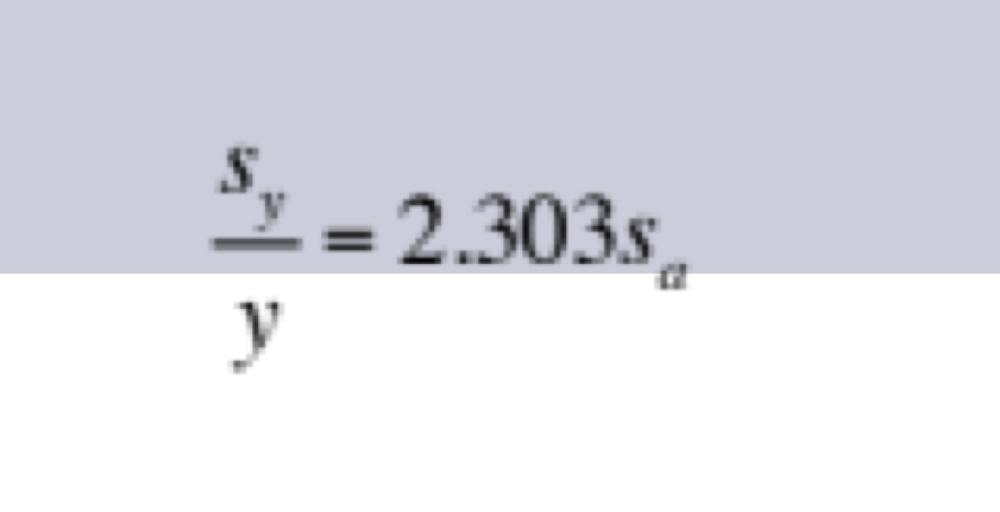 to find H+ |
front 20 If you have an uncalibrated pipet what happens to standard deviations when propagating error | back 20 Random error now becomes systematic error. Basically, take how many n multiples you have to equal the (final) measured out volume and multiply that by the (constant) standard deviation. |
front 21 Gaussian Distribution | back 21 the broader the distribution the greater s is and less precision. i.e. you want a steep narrow curve |
front 22 z score | back 22 how many standard deviations you are from the mean |
front 23 standard deviation of the mean | back 23 σn is a measure of the uncertainty of the mean of n measurements σn = σ / n1/2 larger samples = smaller SEM makers error look smaller |
front 24 F test | back 24 to decide whether 2 S.D. are SIG DIFF from each other --> If F calc > Ftable then data sets are statistically different and precision is not the same |
front 25 Confidence intervals | back 25 Use to compare mean measure by different methods. Allows us to state a range of values that include the population mean. Confidence interval is calculated to determine if the known value is significantly different from the measured value. |
front 26 T-test type 1 | back 26 compare an experimental mean with an accepted mean. think given means then use CI equations. Also deals with accuracy |