General Statistics: Ch 6 Quiz
Assume that thermometer readings are normally distributed with a mean of 0°C and a standard deviation of 1.00°C. A thermometer is randomly selected and tested.
For the case below, draw a sketch, and find the probability of the reading. (The given values are in Celsius degrees.)
Between –1.47 and 1.87
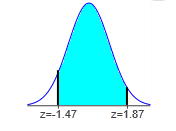
The probability of getting a reading between –1.47°C and 1.87°C is 0.8985 .
P(-1.47 < z < 1.87)
= (0.9693 – 0.0708)
Assume the readings on thermometers are normally distributed with a mean of 0°C and a standard deviation of 1.00°C.
Find the probability that a randomly selected thermometer reads greater than 0.04 and draw a sketch of the region.
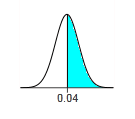
The probability is 0.4840.
P(z > 0.04)
= 1 – P(z < 0.04)
= 1 – 0.5160 = 0.4840
OR
Symmetric to z score of -0.04 (Area = 0.4840)
Assume that a randomly selected subject is given a bone density test. Those test scores are normally distributed with a mean of 0 and a standard deviation of 1.
Find the probability that a given score is less than –0.56 and draw a sketch of the region.
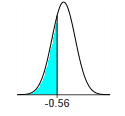
The probability is 0.2877.
P(z < -0.56) = 0.2877
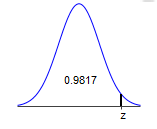
Find the indicated z score. The graph depicts the standard normal distribution with mean 0 and standard deviation 1.
The indicated z score is 2.09.
Find the indicated z score. The graph depicts the standard normal distribution with mean 0 and standard deviation 1.
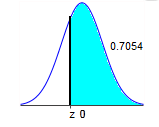
The indicated z score is –0.54.
Symmetric to Area of 0.7054 (z = 0.54)
OR
Area = 1 – 0.7054 = 0.2946
A statistics professor plans classes so carefully that the lengths of her classes are uniformly distributed between 49.0 and 59.0 minutes.
Find the probability that a given class period runs between 50.5 and 51.5 minutes.
0. 1 00
49.0 = 10.0
Since the uniform distribution is rectangular, has a length of 10.0, and an area of 1, the height of the uniform distribution is 0.1.
P(between 50.5 and 51.5) = (shaded region length) × (shaded region height)
= (51.5 – 50.5) × (0.1)
= 0.1
Assume that a randomly selected subject is given a bone density test. Those test scores are normally distributed with a mean of 0 and a standard deviation of 1.
Find the probability that a given score is less than 3.69 and draw a sketch of the region.
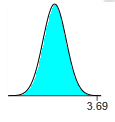
The probability is 0.9999.
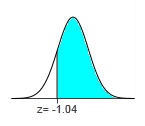
Find the area of the shaded region. The graph depicts the standard normal distribution of bone density scores with mean 0 and standard deviation 1.
The area of the shaded region is 0.8508.
P(z > 0.04)
= 1 – P(z < -1.04)
= 1 – 0.1492 = 0.8505
OR
Symmetric to z score of 1.04 (Area = 0.8508)
The waiting times between a subway departure schedule and the arrival of a passenger are uniformly distributed between 0 and 6 minutes. Find the probability that a randomly selected passenger has a waiting time greater than 4.25 minutes.
0.298
P(greater than 45.25) = (length of shaded region) × (height of shaded region)
= (6 – 5.25) × (0.167)-round to 2 dec. places
= (1.75 × (0.17)
= 0.2975
Assume that thermometer readings are normally distributed with a mean of 0°C and a standard deviation of 1.00°C. A thermometer is randomly selected and tested.
For the case below, draw a sketch, and find the probability of the reading. (The given values are in Celsius degrees.)
Between –0.50 and 2.00
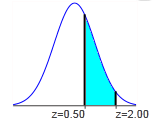
The probability of getting a reading between 0.50°C and 2.00°C is 0.2857.
P(0.50 < z < 2.00)
= (0.9772 – 0.6915)