General Statistics: Ch 2 Quiz
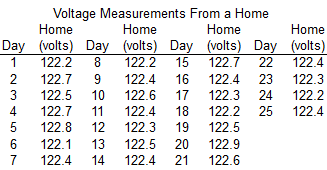
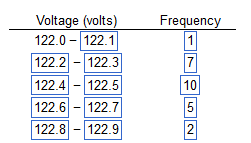
Refer to the accompanying data set and use the 25 home voltage measurements to construct a frequency distribution with five classes. Begin with a lower class limit of 122.0 volts, and use a class width of 0.2 volt.
Does the result appear to have a normal distribution? Why or why not?
Yes, because the frequencies start low, reach a maximum, then become low again, and are roughly symmetric about the maximum frequency.
Does the frequency distribution appear to have a normal distribution using a strict interpretation of the relevant criteria?
No, the distribution does not appear to be normal.
Construct the cumulative frequency distribution for the given data.
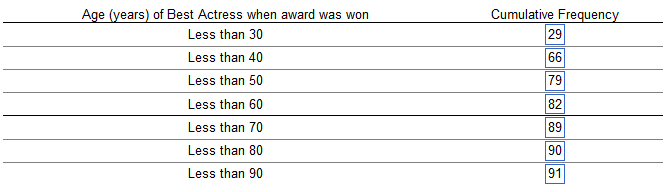
What is the class width?
What are the class midpoints?
What are the class boundaries?
5
63.45, 68.45, ..., 103.45, 108.45
60.95, 65.95, ..., 100.95, 105.95, 110.95
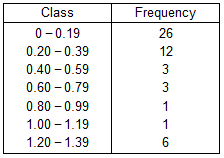
The table below shows the frequency distribution of the rainfall on 52 consecutive Wednesdays in a certain city. Use the frequency distribution to construct a histogram.
Do the data appear to have a distribution that is approximately normal?
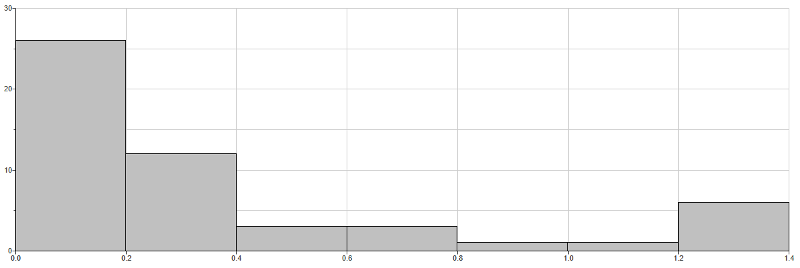
No, it is not symmetric.
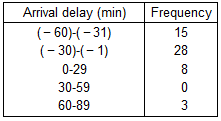
The frequency distribution below shows arrival delays for airplane flights.
Use the frequency distribution to construct a histogram. Which part of the histogram depicts flights that arrived early, and which part depicts flights that arrived late?
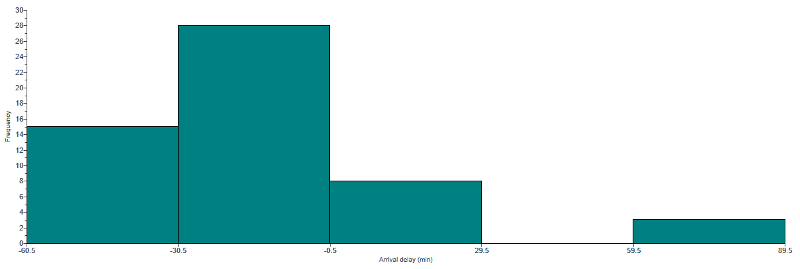
The two leftmost bars depict flights that arrived early, and the other bars to the right depict flights that arrived late.
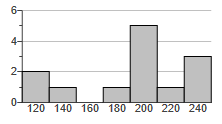
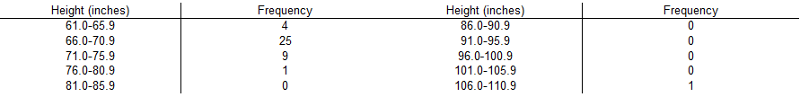
The histogram to the right represents the weights (in pounds) of members of a certain high-school math team.
How many team members are included in the histogram?
The histogram represents 13 math team members.
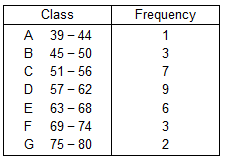
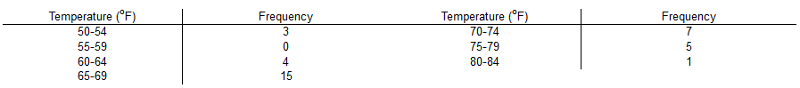
The frequency distribution below represents frequencies of actual low temperatures recorded during the course of a 31-day month.
Use the frequency distribution to construct a histogram.
Do the data appear to have a distribution that is approximately normal?

Yes, the distribution does appear to be normal.
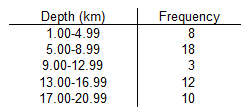
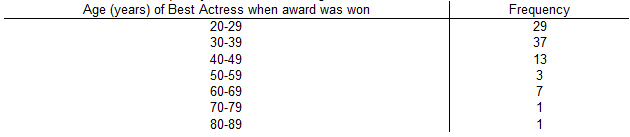
The given data represents a frequency distribution of the depth of recent earthquakes. Use the frequency distribution to construct a frequency polygon.
Applying a strict interpretation of the requirements for a normal distribution, do the depths appear to be normally distributed? Why or why not?
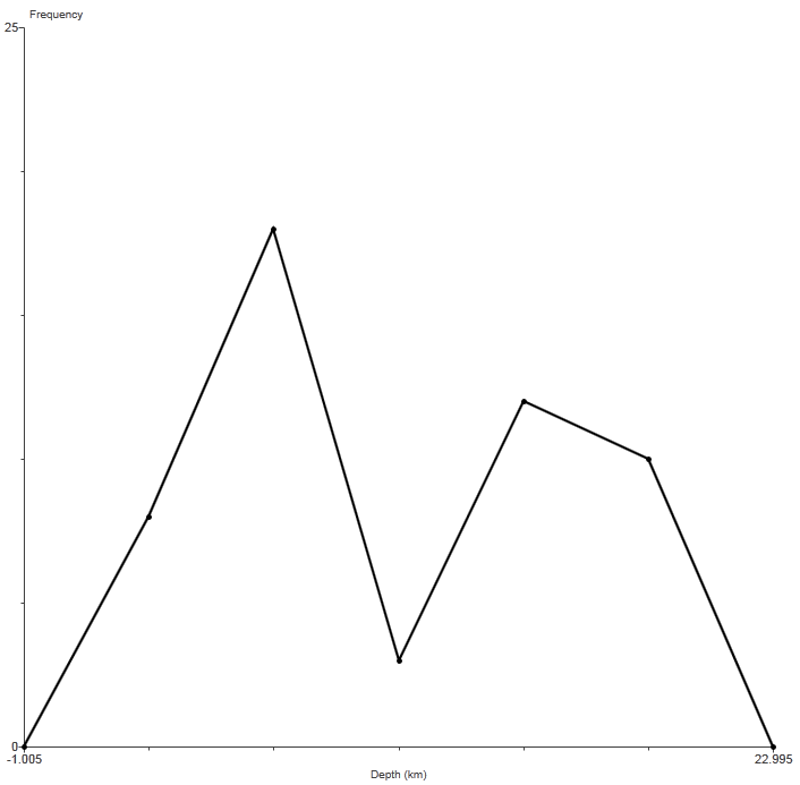
The frequency polygon does not appear to approximate a normal distribution because the frequencies do not increase to a maximum and then decrease, and the graph is not symmetric.
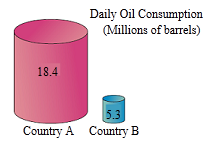
The graph to the right uses cylinders to represent barrels of oil consumed by two countries.
Does the graph distort the data? Why or why not? If the graph distorts the data, construct a graph that depicts the data fairly.
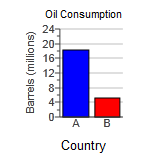
Yes, because the graph incorrectly uses objects of volume to represent the data.
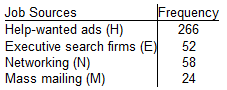
A study was conducted to determine how people get jobs. The table lists data from 400 randomly selected subjects.
Construct a Pareto chart that corresponds to the given data.
If someone would like to get a job, what seems to be the most effective approach?
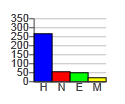
Help-wanted ads (H)
Which of the following is NOT true about statistical graphs?
They utilize areas or volumes for data that are one-dimensional in nature.
Which of the following is a common distortion that occurs in graphs?
Using a two-dimensional object to represent data that are one-dimensional in nature
Why is it important to learn about bad graphs?
So that we can critically analyze a graph to determine whether it is misleading