General Statistics: Ch 1, Sec 1.2 Quiz

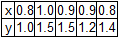
In the data table below, the x-values are the weights (in pounds) of cars and the y-values are the corresponding highway fuel consumption amounts (in mi/gal).
Given the context of the car measurement data, what issue can be addressed by conducting a statistical analysis of the values?
Is there a relationship or an association between the weight of a car and its fuel consumption amount?
An editorial criticized a chart caption that described a dental floss as one that "reduces the chance of plaque on teeth by over 400 percent."
What is wrong with this statement?
A reduction of 100% would eliminate all plaque, so it is not possible to reduce it by more than 100%.
The x-values in the table to the right are the nicotine amounts (in mg) in different 100 mm filtered, non-"light" menthol cigarettes. The y-values are the nicotine amounts (in mg) in different king-size nonfiltered, nonmenthol, and non-"light" cigarettes.
If suitable methods of statistics are used, it can be concluded that the average (mean) nicotine amount of the 100 mm filtered, non-"light" menthol cigarettes is less than the average (mean) nicotine amount of the king-size nonfiltered, nonmenthol, and non-"light" cigarettes.
Can it be concluded that the first type of cigarette is safe? Why or why not?
Since the first type of cigarette contains less nicotine than the second type of cigarette, the first type is safer. However, it cannot be concluded that it is safe.
Which of the following is NOT a misuse of statistics?
Utilizing valid statistical methods and correct sampling techniques