Ecology midterm 2 graphs and variables
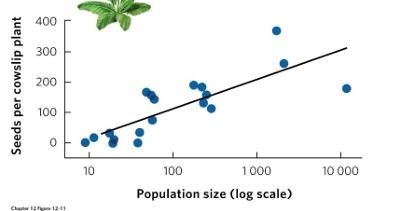
What's this graph called?
Positive density dependence graph
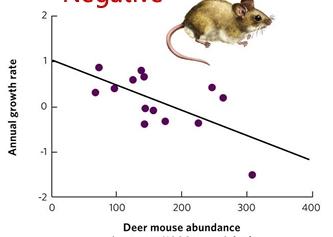
What's this graph called?
A Negative density dependence graph
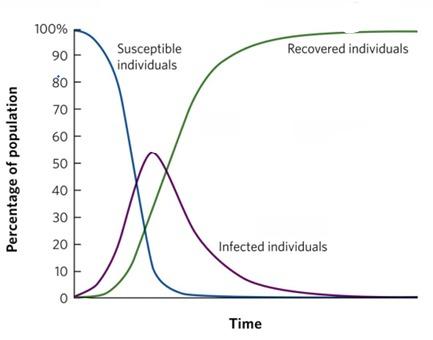
What's this graph called?
A Model of infectious disease transmission
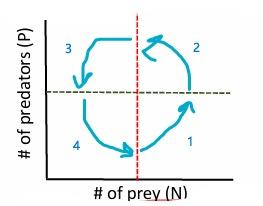
What's this graph called?
The Lotka-Volterra model
What's this graph called?
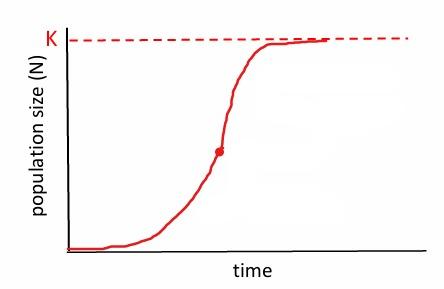
The logistic growth model
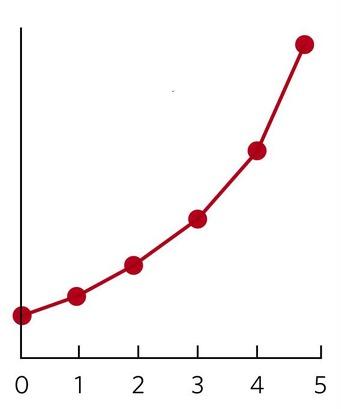
What's this graph called?
A geometric growth rate graph
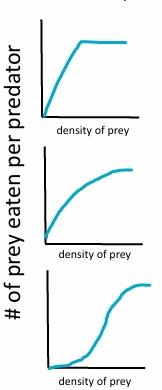
What are these graphs called?
Functional responses
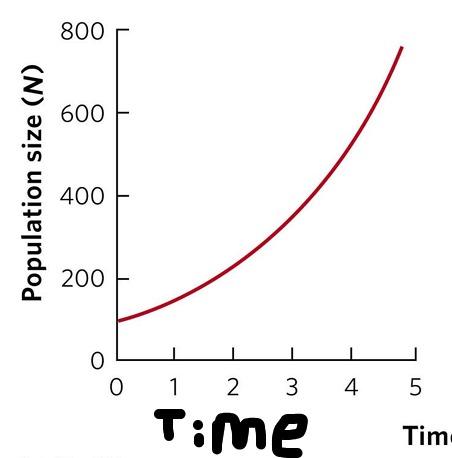
What's this graph called?
An exponential growth rate graph
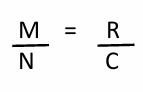
What are the variables in this equation?
M=Marked in the first capture
N=population size
R=Recaptured in the second round
C=Captured in the second round
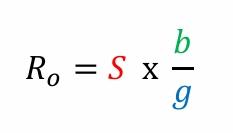
What are the variables in this equation?
S=susceptible individuals
b=rate of transmission
g=rate of recovery
R0=number of new infections per infected individual
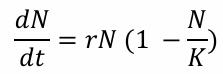
What are the variables in this equation?
N=population number
r=intrinsic growth rate
t=time
K=carrying capacity
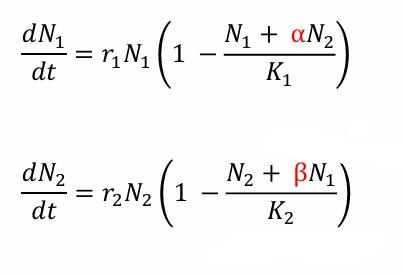
What are the variables in these equations?
N=population number
r=intrinsic growth rate
t=time
K=carrying capacity
alpha and beta=competition coefficients
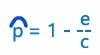
What are the variables in this equation?
p=fraction of occupied patches
e=probability of a patch going extinct
c=probability of colonization
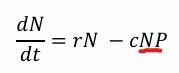
What are the variables and combination of variables in this equation?
N=population number
r=intrinsic growth rate
c=capture efficiency
P=predator abundance
NP=Probability of encounter between predator and prey
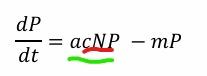
What are the variables and combination of variables in this equation?
N=population number
r=intrinsic growth rate
c=capture efficiency
P=predator abundance
m=mortality rate
a=conversion efficiency
cNP=Probability of capturing prey
acNP=predator birthrate