Instructions for Side by Side Printing
- Print the notecards
- Fold each page in half along the solid vertical line
- Cut out the notecards by cutting along each horizontal dotted line
- Optional: Glue, tape or staple the ends of each notecard together
FINC314 CH6
front 1 Risk that can be eliminated through diversification is called ______ risk. unique firm-specific diversifiable all of these options | back 1 D |
front 2 The _______ decision should take precedence over the _____ decision. asset allocation; stock selection bond selection; mutual fund selection stock selection; asset allocation stock selection; mutual fund selection | back 2 A |
front 3 Many current and retired Enron Corp. employees had their 401k retirement accounts wiped out when Enron collapsed because ________. they had to pay huge fines for obstruction of justice their 401k accounts were held outside the company their 401k accounts were not well diversified none of these options | back 3 C |
front 4 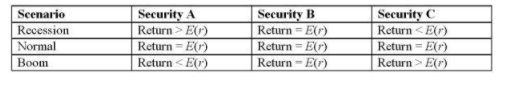 Based on the outcomes in the following table, choose which of the statements below is (are) correct? I. The covariance of security A and security B is zero. II. The correlation coefficient between securities A and C is negative. The correlation coefficient between securities B and C is positive. I only I and II only II and III only I, II, and III | back 4 B |
front 5 Asset A has an expected return of 15% and a reward-to-variability ratio of .4. Asset B has an expected return of 20% and a reward-to-variability ratio of .3. A risk-averse investor would prefer a portfolio using the risk-free asset and ______. asset A asset B no risky asset The answer cannot be determined from the data given. | back 5 A |
front 6 Adding additional risky assets to the investment opportunity set will generally move the efficient frontier _____ and to the ______. up; right up; left down; right down; left | back 6 B |
front 7 An investor's degree of risk aversion will determine his or her ______. optimal risky portfolio risk-free rate optimal mix of the risk-free asset and risky asset capital allocation line | back 7 C |
front 8 The ________ is equal to the square root of the systematic variance divided by the total variance. covariance correlation coefficient standard deviation reward-to-variability ratio | back 8 B |
front 9 Which of the following statistics cannot be negative? A. covariance | back 9 B |
front 10 10. Asset A has an expected return of 20% and a standard deviation of 25%. The risk-free rate is 10%. What is the reward-to-variability ratio? A. .40 B. .50 C. .75 D. .80 | back 10 A |
front 11 11. The correlation coefficient between two assets equals _________. their covariance divided by the product of their variances the product of their variances divided by their covariance the sum of their expected returns divided by their covariance their covariance divided by the product of their standard deviations | back 11 D |
front 12 12. Diversification is most effective when security returns are _________. high negatively correlated positively correlated uncorrelated | back 12 B |
front 13 13. The expected rate of return of a portfolio of risky securities is _________. A. the sum of the securities' covariance | back 13 C |
front 14 14. Beta is a measure of security responsiveness to _________. firm-specific risk diversifiable risk market risk unique risk | back 14 C |
front 15 15. The risk that can be diversified away is __________. beta firm-specific risk market risk systematic risk | back 15 B |
front 16 16. Approximately how many securities does it take to diversify almost all of the unique risk from a portfolio? 2 6 8 20 | back 16 D |
front 17 17. Consider an investment opportunity set formed with two securities that are perfectly negatively correlated. The global minimum-variance portfolio has a standard deviation that is always _________. equal to the sum of the securities' standard deviations equal to -1 equal to 0 greater than 0 | back 17 C |
front 18 18. Market risk is also called __________ and _________. systematic risk; diversifiable risk systematic risk; nondiversifiable risk unique risk; nondiversifiable risk unique risk; diversifiable risk | back 18 B |
front 19 19. Firm-specific risk is also called __________ and __________. systematic risk; diversifiable risk systematic risk; nondiversifiable risk unique risk; nondiversifiable risk unique risk; diversifiable risk | back 19 D |
front 20 20. Which one of the following stock return statistics fluctuates the most over time? A. covariance of returns | back 20 C |
front 21 21. Harry Markowitz is best known for his Nobel Prize-winning work on _____________. strategies for active securities trading techniques used to identify efficient portfolios of risky assets techniques used to measure the systematic risk of securities techniques used in valuing securities options | back 21 B |
front 22 22. Suppose that a stock portfolio and a bond portfolio have a zero correlation. This means that ______. the returns on the stock and bond portfolios tend to move inversely the returns on the stock and bond portfolios tend to vary independently of each other the returns on the stock and bond portfolios tend to move together the covariance of the stock and bond portfolios will be positive | back 22 B |
front 23 You put half of your money in a stock portfolio that has an expected return of 14% and a standard deviation of 24%. You put the rest of your money in a risky bond portfolio that has an expected return of 6% and a standard deviation of 12%. The stock and bond portfolios have a correlation of .55. The standard deviation of the resulting portfolio will be ________________. more than 18% but less than 24% equal to 18% more than 12% but less than 18% equal to 12% | back 23 C |
front 24 24. On a standard expected return versus standard deviation graph, investors will prefer portfolios that lie to the _____________ the current investment opportunity set. left and above left and below right and above right and below | back 24 A |
front 25 25. The term complete portfolio refers to a portfolio consisting of _________________. the risk-free asset combined with at least one risky asset the market portfolio combined with the minimum-variance portfolio securities from domestic markets combined with securities from foreign markets common stocks combined with bonds | back 25 A |
front 26 26. Rational risk-averse investors will always prefer portfolios _____________. located on the efficient frontier to those located on the capital market line located on the capital market line to those located on the efficient frontier at or near the minimum-variance point on the efficient frontier that are risk-free to all other asset choices | back 26 B |
front 27 27. The optimal risky portfolio can be identified by finding: I. The minimum-variance point on the efficient frontier II. The maximum-return point on the efficient frontier and the minimum-variance point on the efficient frontier III. The tangency point of the capital market line and the efficient frontier IV. The line with the steepest slope that connects the risk-free rate to the efficient frontier I and II only II and III only III and IV only I and IV only | back 27 C |
front 28 28. The _________ reward-to-variability ratio is found on the ________ capital market line. lowest; steepest highest; flattest highest; steepest lowest; flattest | back 28 C |
front 29 29. A portfolio is composed of two stocks, A and B. Stock A has a standard deviation of return of 24%, while stock B has a standard deviation of return of 18%. Stock A comprises 60% of the portfolio, while stock B comprises 40% of the portfolio. If the variance of return on the portfolio is .0380, the correlation coefficient between the returns on A and B is _________. A. .583 B. .225 C. .327 D. .128 | back 29 A |
front 30 30. The standard deviation of return on investment A is .10, while the standard deviation of return on investment B is .05. If the covariance of returns on A and B is .0030, the correlation coefficient between the returns on A and B is _________. A. .12 B. .36 C. .60 D. .77 | back 30 C |
front 31 31. A portfolio is composed of two stocks, A and B. Stock A has a standard deviation of return of 35%, while stock B has a standard deviation of return of 15%. The correlation coefficient between the returns on A and B is .45. Stock A comprises 40% of the portfolio, while stock B comprises 60% of the portfolio. The standard deviation of the return on this portfolio is _________. 23% 19.76% 18.45% 17.67% | back 31 B |
front 32 32. The standard deviation of return on investment A is .10, while the standard deviation of return on investment B is .04. If the correlation coefficient between the returns on A and B is -.50, the covariance of returns on A and B is _________. -.0447 -.0020 .0020 .0447 | back 32 B |
front 33 33. Consider two perfectly negatively correlated risky securities, A and B. Security A has an expected rate of return of 16% and a standard deviation of return of 20%. B has an expected rate of return of 10% and a standard deviation of return of 30%. The weight of security B in the minimum-variance portfolio is _________. 10% 20% 40% 60% | back 33 C |
front 34 34. An investor can design a risky portfolio based on two stocks, A and B. Stock A has an expected return of 18% and a standard deviation of return of 20%. Stock B has an expected return of 14% and a standard deviation of return of 5%. The correlation coefficient between the returns of A and B is .50. The risk-free rate of return is 10%. The proportion of the optimal risky portfolio that should be invested in stock A is _________. 0% 40% 60% 100% | back 34 A |
front 35 An investor can design a risky portfolio based on two stocks, A and B. Stock A has an expected return of 18% and a standard deviation of return of 20%. Stock B has an expected return of 14% and a standard deviation of return of 5%. The correlation coefficient between the returns of A and B is .50. The risk-free rate of return is 10%. The expected return on the optimal risky portfolio is _________. 14% 15.6% 16.4% 18% | back 35 A |
front 36 An investor can design a risky portfolio based on two stocks, A and B. Stock A has an expected return of 18% and a standard deviation of return of 20%. Stock B has an expected return of 14% and a standard deviation of return of 5%. The correlation coefficient between the returns of A and B is .50. The risk-free rate of return is 10%. The standard deviation of return on the optimal risky portfolio is _________. 0% 5% 7% 20% | back 36 B |
front 37 An investor can design a risky portfolio based on two stocks, A and B. Stock A has an expected return of 21% and a standard deviation of return of 39%. Stock B has an expected return of 14% and a standard deviation of return of 20%. The correlation coefficient between the returns of A and B is .4. The risk-free rate of return is 5%. The proportion of the optimal risky portfolio that should be invested in stock B is approximately _________. 29% 44% 56% 71% | back 37 D |
front 38 An investor can design a risky portfolio based on two stocks, A and B. Stock A has an expected return of 21% and a standard deviation of return of 39%. Stock B has an expected return of 14% and a standard deviation of return of 20%. The correlation coefficient between the returns of A and B is .4. The risk-free rate of return is 5%. The expected return on the optimal risky portfolio is approximately _________. (Hint: Find weights first.) 14% 16% 18% 19% | back 38 B |
front 39 39. An investor can design a risky portfolio based on two stocks, A and B. Stock A has an expected return of 21% and a standard deviation of return of 39%. Stock B has an expected return of 14% and a standard deviation of return of 20%. The correlation coefficient between the returns of A and B is .4. The risk-free rate of return is 5%. The standard deviation of returns on the optimal risky portfolio is _________. 25.5% 22.3% 21.4% D. 20.7% | back 39 C |
front 40 40. An investor can design a risky portfolio based on two stocks, A and B. The standard deviation of return on stock A is 24%, while the standard deviation on stock B is 14%. The correlation coefficient between the returns on A and B is .35. The expected return on stock A is 25%, while on stock B it is 11%. The proportion of the minimum-variance portfolio that would be invested in stock B is approximately _________. 45% 67% 85% 92% | back 40 C |
front 41 41. An investor can design a risky portfolio based on two stocks, A and B. The standard deviation of return on stock A is 20%, while the standard deviation on stock B is 15%. The correlation coefficient between the returns on A and B is 0%. The rate of return for stocks A and B is 20 and 10 respectively. The expected return on the minimum-variance portfolio is approximately _________. 10% 13.6% 15% 19.41% | back 41 B |
front 42 42. An investor can design a risky portfolio based on two stocks, A and B. The standard deviation of return on stock A is 20%, while the standard deviation on stock B is 15%. The correlation coefficient between the returns on A and B is 0%. The standard deviation of return on the minimum-variance portfolio is _________. 0% 6% 12% 17% | back 42 C |
front 43 43. A measure of the riskiness of an asset held in isolation is ____________. beta standard deviation covariance alpha | back 43 B |
front 44 44. Semitool Corp. has an expected excess return of 6% for next year. However, for every unexpected 1% change in the market, Semitool's return responds by a factor of 1.2. Suppose it turns out that the economy and the stock market do better than expected by 1.5% and Semitool's products experience more rapid growth than anticipated, pushing up the stock price by another 1%. Based on this information, what was Semitool's actual excess return? 7% 8.5% 8.8% 9.25% | back 44 C |
front 45 45. The part of a stock's return that is systematic is a function of which of the following variables? I. Volatility in excess returns of the stock market II. The sensitivity of the stock's returns to changes in the stock market The variance in the stock's returns that is unrelated to the overall stock market I only I and II only II and III only I, II, and III | back 45 B |
front 46 46. Stock A has a beta of 1.2, and stock B has a beta of 1. The returns of stock A are ______ sensitive to changes in the market than are the returns of stock B. 20% more slightly more 20% less slightly less | back 46 A |
front 47 47. Which risk can be partially or fully diversified away as additional securities are added to a portfolio? I. Total risk II. Systematic risk Firm-specific risk I only I and II only I, II, and III I and III | back 47 D |
front 48 48. According to Tobin's separation property, portfolio choice can be separated into two independent tasks consisting of __________ and __________. A.identifying all investor imposed constraints; identifying the set
of securities that conform to the investor's constraints and offer the
best risk-return trade-offs C.identifying the optimal risky portfolio; constructing a complete
portfolio from T-bills and the optimal risky portfolio based on the
investor's degree of risk aversion | back 48 C |
front 49 You are constructing a scatter plot of excess returns for stock A versus the market index. If the correlation coefficient between stock A and the index is -1, you will find that the points of the scatter diagram ___________ and the line of best fit has a ______________. all fall on the line of best fit; positive slope all fall on the line of best fit; negative slope are widely scattered around the line; positive slope are widely scattered around the line; negative slope | back 49 B |
front 50 50. The term excess return refers to ______________. returns earned illegally by means of insider trading the difference between the rate of return earned and the risk-free rate the difference between the rate of return earned on a particular security and the rate of return earned on other securities of equivalent risk the portion of the return on a security that represents tax liability and therefore cannot be reinvested | back 50 B |
front 51 51. You are recalculating the risk of ACE stock in relation to the market index, and you find that the ratio of the systematic variance to the total variance has risen. You must also find that the ____________. covariance between ACE and the market has fallen correlation coefficient between ACE and the market has fallen correlation coefficient between ACE and the market has risen unsystematic risk of ACE has risen | back 51 C |
front 52 52. A stock has a correlation with the market of .45. The standard deviation of the market is 21%, and the standard deviation of the stock is 35%. What is the stock's beta? A. 1 B. .75 C. .60 D. .55 | back 52 B |
front 53 53. The values of beta coefficients of securities are __________. always positive always negative always between positive 1 and negative 1 usually positive but are not restricted in any particular way | back 53 D |
front 54 54. A security's beta coefficient will be negative if ____________. its returns are negatively correlated with market-index returns its returns are positively correlated with market-index returns its stock price has historically been very stable market demand for the firm's shares is very low | back 54 A |
front 55 55. The market value weighted-average beta of firms included in the market index will always be _____________. 0 between 0 and 1 1 none of these options (There is no particular rule concerning the average beta of firms included in the market index.) | back 55 C |
front 56 56. Diversification can reduce or eliminate __________ risk. all systematic nonsystematic D. only an insignificant | back 56 C |
front 57 57. To construct a riskless portfolio using two risky stocks, one would need to find two stocks with a correlation coefficient of ________. A. 1 B. .5 0 -1 | back 57 D |
front 58 58. Some diversification benefits can be achieved by combining securities in a portfolio as long as the correlation between the securities is _____________. 1 less than 1 between 0 and 1 less than or equal to 0 | back 58 B |
front 59 59. If an investor does not diversify his portfolio and instead puts all of his money in one stock, the appropriate measure of security risk for that investor is the ________. stock's standard deviation variance of the market stock's beta covariance with the market index | back 59 A |
front 60 60. Which of the following provides the best example of a systematic-risk event? A strike by union workers hurts a firm's quarterly earnings. Mad Cow disease in Montana hurts local ranchers and buyers of beef. The Federal Reserve increases interest rates 50 basis points. A senior executive at a firm embezzles $10 million and escapes to South America. | back 60 C |
front 61 61. Which of the following statements is (are) true regarding time diversification? I. The standard deviation of the average annual rate of return over several years will be smaller than the 1-year standard deviation. II. For a longer time horizon, uncertainty compounds over a greater number of years. Time diversification does not reduce risk. I only II only II and III only I, II, and III | back 61 C |
front 62 62. You find that the annual Sharpe ratio for stock A returns is equal to 1.8. For a 3-year holding period, the Sharpe ratio would equal _______. 1.8 2.48 3.12 5.49 | back 62 C |
front 63 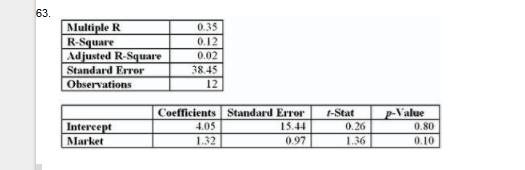 The beta of this stock is ____. A. .12 B. .35 1.32 4.05 | back 63 C |
front 64 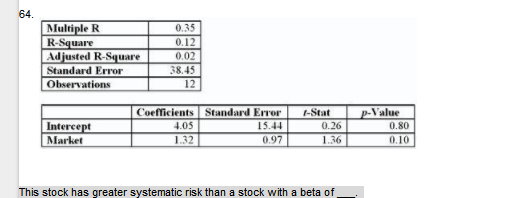 This stock has greater systematic risk than a stock with a beta of ___. A. .50 1.5 2 3 | back 64 A |
front 65 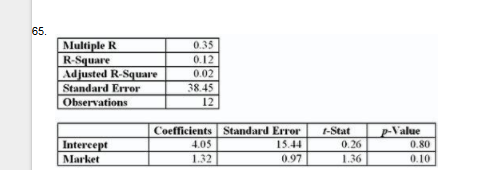 The characteristic line for this stock is Rstock = ___ + ___ Rmarket. A. .35; .12 4.05; 1.32 15.44; .97 D. 26; 1.36 | back 65 B |
front 66 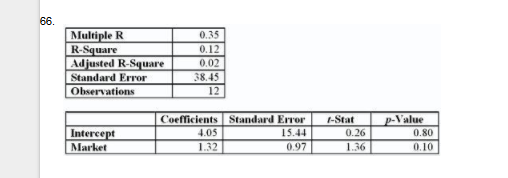 _______________ % of the variance is explained by this regression. 12 35 4.05 80 | back 66 A |
front 67 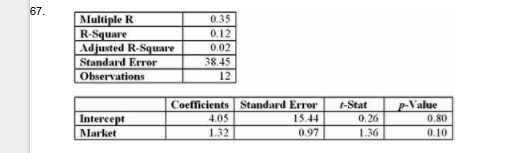 The stock is ______ riskier than the typical stock. 32% 15.44% 12% 38% | back 67 A |
front 68 68. Decreasing the number of stocks in a portfolio from 50 to 10 would likely ________________. increase the systematic risk of the portfolio increase the unsystematic risk of the portfolio increase the return of the portfolio decrease the variation in returns the investor faces in any one year | back 68 B |
front 69 69. If you want to know the portfolio standard deviation for a three-stock portfolio, you will have to ______. calculate two covariances and one trivariance calculate only two covariances calculate three covariances average the variances of the individual stocks | back 69 C |
front 70 70. Which of the following correlation coefficients will produce the least diversification benefit? -.6 -.3 0 .8 | back 70 D |
front 71 71. Which of the following correlation coefficients will produce the most diversification benefits? -.6 -.9 0 .4 | back 71 B |
front 72 72. What is the most likely correlation coefficient between a stock-index mutual fund and the S&P 500? -1 0 1 .5 | back 72 C |
front 73 73. Investing in two assets with a correlation coefficient of -.5 will reduce what kind of risk? A. market risk | back 73 D |
front 74 74. Investing in two assets with a correlation coefficient of 1 will reduce which kind of risk? A. market risk | back 74 D |
front 75 75. A portfolio of stocks fluctuates when the Treasury yields change. Since this risk cannot be eliminated through diversification, it is called __________. firm-specific risk systematic risk unique risk none of the options | back 75 B |
front 76 76. As you lengthen the time horizon of your investment period and decide to invest for multiple years, you will find that: I. The average risk per year may be smaller over longer investment horizons. II. The overall risk of your investment will compound over time. Your overall risk on the investment will fall. I only I and II only III only I, II, and III | back 76 B |
front 77 . You are considering adding a new security to your portfolio. To decide whether you should add the security, you need to know the security's: I. Expected return II. Standard deviation Correlation with your portfolio I only I and II only I and III only I, II, and III | back 77 D |
front 78 Which of the following is a correct expression concerning the formula for the standard deviation of returns of a two-asset portfolio where the correlation coefficient is positive? A. σ2rp < (W12σ12 + W22σ22) | back 78 D |
front 79 79. What is the standard deviation of a portfolio of two stocks given the following data: Stock A has a standard deviation of 18%. Stock B has a standard deviation of 14%. The portfolio contains 40% of stock A, and the correlation coefficient between the two stocks is -.23. 9.7% 12.2% 14% 15.6% | back 79 A |
front 80 80. What is the standard deviation of a portfolio of two stocks given the following data: Stock A has a standard deviation of 30%. Stock B has a standard deviation of 18%. The portfolio contains 60% of stock A, and the correlation coefficient between the two stocks is -1. 0% 10.8% 18% 24% | back 80 B |
front 81 81. The expected return of a portfolio is 8.9%, and the risk-free rate is 3.5%. If the portfolio standard deviation is 12%, what is the reward-to-variability ratio of the portfolio? A. 0 B. .45 C. .74 D. 1.35 | back 81 B |
front 82 82. A project has a 60% chance of doubling your investment in 1 year and a 40% chance of losing half your money. What is the standard deviation of this investment? 25% 50% 62% 73% | back 82 D |
front 83 83. A project has a 50% chance of doubling your investment in 1 year and a 50% chance of losing half your money. What is the expected return on this investment project? 0% 25% 50% 75% | back 83 B |
front 84 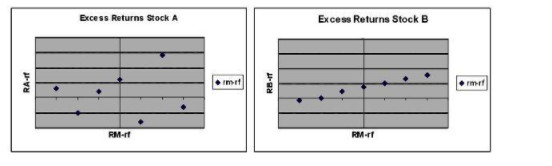 84. The figures below show plots of monthly excess returns for two stocks plotted against excess returns for a market index. Which stock is likely to further reduce risk for an investor currently holding her portfolio in a well-diversified portfolio of common stock? Stock A Stock B There is no difference between A or B. The answer cannot be determined from the information given. | back 84 A |
front 85 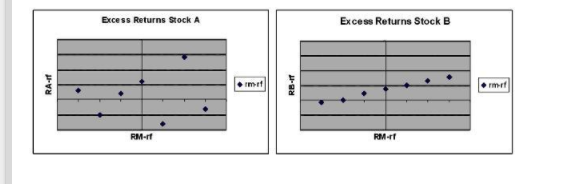 85. The figures below show plots of monthly excess returns for two stocks plotted against excess returns for a market index. Which stock is riskier to a nondiversified investor who puts all his money in only one of these stocks? Stock A is riskier. Stock B is riskier. Both stocks are equally risky. The answer cannot be determined from the information given. | back 85 A |
front 86 86. In the article “Danger: High Levels of Company Stock,” what is the maximum amount of your employer’s stock that the author recommends you hold in your retirement account? A. 5% | back 86 B |
front 87 87. The efficient frontier represents a set of portfolios that A. maximize expected return for a given level of risk. | back 87 A |
front 88 88. The portfolio with the lowest standard deviation for any risk premium is called the_______. A. CAL portfolio | back 88 C |
front 89 89. Lear Corp. has an expected excessreturn of 8% next year. Assume Lear’s beta is 1.43. If the economy booms and the stock market beats expectations by 5%, what was Lear’s actual excess return? A. 7.15% | back 89 C |
front 90 90. The plot of a security’s excess return relative to the market’s excess return is called the _______. A. efficient frontier | back 90 B |