Instructions for Side by Side Printing
- Print the notecards
- Fold each page in half along the solid vertical line
- Cut out the notecards by cutting along each horizontal dotted line
- Optional: Glue, tape or staple the ends of each notecard together
Ch.53
front 1 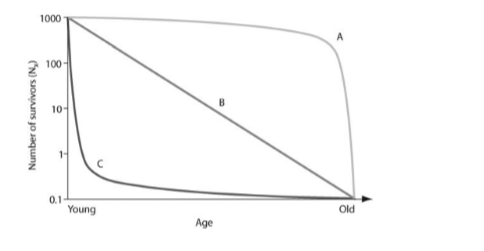 In the figure, which of the following survivorship curves implies
that an animal may lay many eggs, of which a regular number die each
year on a logarithmic scale? C) curve C | back 1 B) curve B |
front 2 In the figure, which of the following survivorship curves most
applies to humans living in developed countries? C) curve C | back 2 A) curve A |
front 3 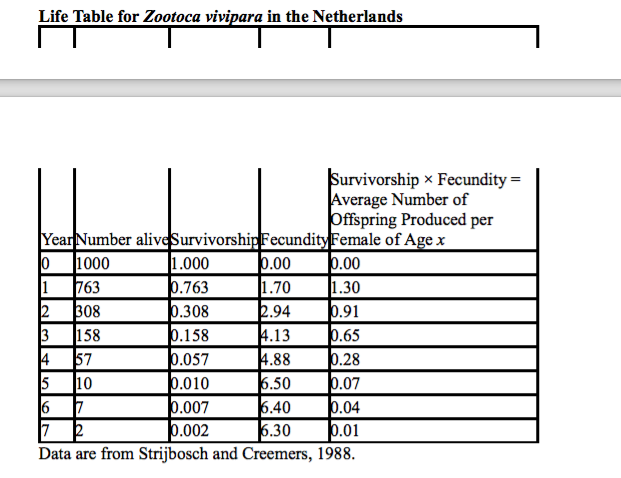 Using the table, how would you describe the population dynamics of
the Eurasian lizard, Z. vivipara? C) The population is stable. | back 3 A) The population is increasing. |
front 4 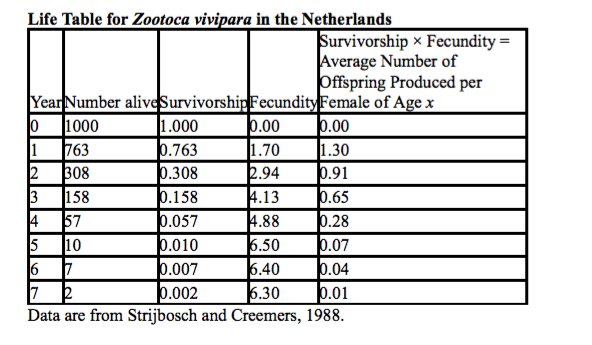 Using the table, determine which age class year would cause the
largest decline in the resulting population growth, if it were wiped
out by disease. C) age class year 3 | back 4 A) age class year 1 |
front 5 Suppose researchers marked 800 turtles and later were able to trap a
total of 300 individuals in that population, of which 150 were marked.
What is the estimate for total population size? C) 1,600 D) 2,100 | back 5 C) 1,600 |
front 6 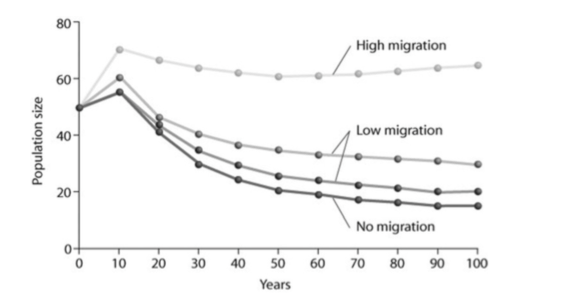 Looking at the figure, what factor is contributing significantly to stabilizing the population size over time?
A) only I | back 6 C) only III |
front 7 Which of the following assumptions must be made regarding the mark-recapture estimate of population size?
individuals have been added by birth or eliminated by death during the course of the estimate. A) I only | back 7 D) I, II, and III |
front 8 Which of the following is the most important assumption for the
mark-recapture method to estimate the size of wildlife
populations? C) There is a 50:50 ratio of males to females in the population
before and after trapping and recapture. | back 8 D) Marked individuals have the same probability of being recaptured as unmarked individuals during the recapture phase. |
front 9 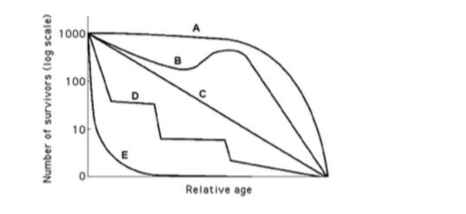 Which curve best describes survivorship in marine mollusks? A)
A D) E | back 9 D) E |
front 10 Which curve best describes survivorship in elephants? A) A D) E | back 10 A) A |
front 11 To measure the population of lake trout in a 250-hectare lake, 400
individual trout were netted and marked with a fin clip, then returned
to the lake. The next week, the lake was netted again, and out of the
200 lake trout that were caught, 50 had fin clips. Using the
mark-recapture estimate, the lake trout population size could be
closest to which of the following? | back 11 C) 1,600 |
front 12 Long-term studies of Belding's ground squirrels show that immigrants
move nearly 2 kilometers from where they are born and become 1%-8% of
the males and 0.7%-6% of the females in other populations. On an
evolutionary scale, why is this significant? stable. | back 12 B) These immigrants provide a source of genetic diversity for the other populations. |
front 13 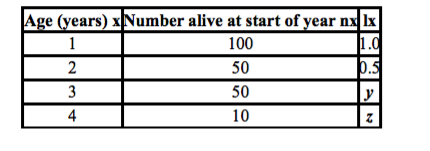 In the accompanying life table of a hypothetical population, what are
the missing values for lx (y and z)? lx = the proportion alive at the
start of year (age specific survivorship rate). C) y = 0.5, z = 0.1 | back 13 C) y = 0.5, z = 0.1 |
front 14 An ecologist recorded 12 white-tailed deer, Odocoileus virginianus,
per square kilometer (km2) in one woodlot and 20 km2 in another
woodlot. What was the ecologist comparing? A) density C) carrying capacity | back 14 A) density |
front 15 Uniform spacing patterns in plants such as the creosote bush are most
often associated with ________. C) competitive interaction between individuals of the same population D) the concentration of nutrients within the population's range | back 15 C) competitive interaction between individuals of the same population |
front 16 Which of the following groups would be most likely to exhibit uniform
dispersion? A) red squirrels, who actively defend territories D) lake trout, which seek out cold, deep water high in dissolved oxygen | back 16 A) red squirrels, who actively defend territories |
front 17 Which of the following examples would most accurately measure the
dispersion of a population being studied? Age (years) x Number alive at start of year nx lx 1 100 1.0 2 50 0.5 3 50 y 4 10 z grassland | back 17 C) measuring the average distance between individuals and their nearest neighbor, and then analyzing the variation and comparing those measurements at larger scales |
front 18 Which of the following is the best natural example of a uniform
pattern of dispersion? A) bees collecting pollen in a wildflower
meadow D) mushrooms growing on the floor of an old growth forest | back 18 D) mushrooms growing on the floor of an old growth forest |
front 19 Which statement best explains survivorship curve B? | back 19 D) Survivorship can only decrease; therefore, this curve could not happen in nature. |
front 20 Which of the following examples are plausible explanations for a population that would produce curve A in the figure? I. II. III. Ongoing predation of rabbits throughout their lives Susceptibility of older humans to heart disease High seedling mortality in sunflowers A) I only | back 20 B) II only |
front 21 Imagine that you are managing a large game ranch. You know from historical accounts that a species of deer used to live there, but they have been extirpated. After doing some research to determine what might be an appropriately sized founding population, you reintroduce them. You then watch the population increase for several generations, and graph the number of individuals (vertical axis) against the number of generations (horizontal axis). With no natural predators impacting the population, the graph will likely appear as ________. A) a diagonal line, getting higher with each generation B) an
"S" that ends with a vertical line | back 21 D) a "J," increasing with each generation |
front 22 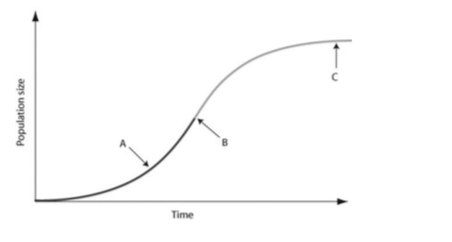 In the figure, which of the arrows represents the carrying capacity?
A) arrow A D) Carrying capacity cannot be found in the figure because species under density-dependent control never reach carrying capacity. | back 22 C) arrow C |
front 23 32) Which statements about K are correct?
A) only I and III | back 23 C) only I, II, and III |
front 24 As N approaches K for a certain population, which of the following
outcomes is predicted by the logistic equation? C) The population size will increase exponentially. | back 24 B) The population growth rate will approach zero. |
front 25 Which of the following causes populations to shift most quickly from
an exponential to a logistic population growth? C) decreased death rate | back 25 D) competition for resources |
front 26 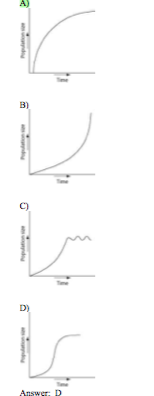 Which of the following graphs best illustrates the growth curve of a small population of rodents that has increased to a static carrying capacity? | back 26 D |
front 27 18) Which of the following scenarios would provide the most accurate data on population density? A) Count the number of nests of a particular species of songbird and multiply this by a factor that extrapolates these data to actual animals. B) Count the number of pine trees in several randomly selected 10-meter-square plots and extrapolate this number to the fraction of the study area these plots represent. C) Use the mark-recapture method to estimate the size of the population. D) Calculate the difference between all of the immigrants and emigrants to see if the population is growing or shrinking. | back 27 B) Count the number of pine trees in several randomly selected 10-meter-square plots and extrapolate this number to the fraction of the study area these plots represent. |