Instructions for Side by Side Printing
- Print the notecards
- Fold each page in half along the solid vertical line
- Cut out the notecards by cutting along each horizontal dotted line
- Optional: Glue, tape or staple the ends of each notecard together
Chapter 10 and 11 Probability and Statistics
front 1 Which of the following is not a requirement for regression analysis? A.Visual examination of the scatterplot shows that the points approximate a straight-line pattern. B.Outliers can have a strong effect on the regression equation, so remove any outliers if they are known to be errors. C.The sample of paired (x,y) data is a random sample of quantitative data. D.The method for regression analysis line is not robust. It is seriously affected by a small departure from a normal distribution. | back 1 D.The method for regression analysis line is not robust. It is seriously affected by a small departure from a normal distribution. |
front 2 A __________ exists between two variables when the values of one variable are somehow associated with the values of the other variable. | back 2 Correlation |
front 3 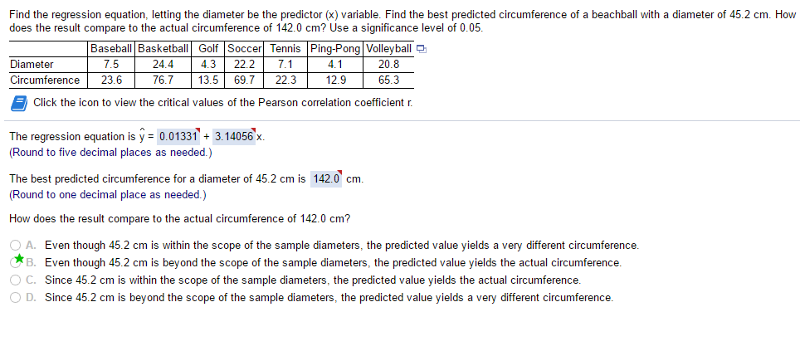 Regression of Diameter and Circumference | back 3 no data |
front 4 The _______ is a nonparametric test that uses ranks of sample data consisting of matched pairs used to test for an association between two variables. | back 4 Rank Correlation Test |
front 5 Which of the following is not a requirement for regression analysis? A.The sample of paired (x,y) data is a random sample of quantitative data. B.The method for regression analysis line is not robust. It is seriously affected by a small departure from a normal distribution.This is the correct answer. C.Outliers can have a strong effect on the regression equation, so remove any outliers if they are known to be errors. D.Visual examination of the scatterplot shows that the points approximate a straight-line pattern. | back 5 B.The method for regression analysis line is not robust. It is seriously affected by a small departure from a normal distribution.This is the correct answer. |
front 6 Which of the following is NOT a key component of the rank correlation test? A.There is a requirement that any population has a normal distribution.This is the correct answer. B.There is no requirement that the sample pairs of data have a bivariate normal distribution. C.An alternative hypothesis for the rank correlation test is that there is a correlation between the two variables. D.The paired data are a simple random sample. | back 6 A.There is a requirement that any population has a normal distribution.This is the correct answer. |
front 7 Given a collection of paired sample data, the ____________________ y hat =b0+b1x algebraically describes the relationship between the two variables, x and y. | back 7 Regression equation |
front 8 Which of the following is NOT true for the rank correlation test? A.The method of rank correlation is more efficient than the method of linear correlation.This is the correct answer. B.With rank correlation, we can analyze paired data that are ranks or can be converted to ranks. C.Rank correlation can be used to detect some relationships that are not linear. D.The nonparametric method of rank correlation can be used in a wider variety of circumstances than the parametric method of linear correlation. | back 8 A.The method of rank correlation is more efficient than the method of linear correlation.This is the correct answer. |
front 9 Which of the following is not equivalent to the other three? Explanatory variable Predictor variable Dependent variableThis is the correct answer Independent variable | back 9 Dependent variableThis is the correct answer |
front 10 Which of the following is NOT a requirement to conduct a goodness-of-fit test? A.For each category, the observed frequency is at least 5.This is the correct answer. B.The sample data consist of frequency counts for each of the different categories. C.For each category, the expected frequency is at least 5. D.The data have been randomly selected. | back 10 A.For each category, the observed frequency is at least 5.This is the correct answer. |
front 11 Which of the following is NOT true of the goodness-of-fit test? A.Expected frequencies need not be whole numbers. B.If expected frequencies are equal, then we can determine them by Upper E equals StartFraction n Over k EndFractionE=nk, where n is the total number of observations and k is the number of categories. C.If expected frequencies are not all equal, then we can determine them by Eequals=np for each individual category, where n is the total number of observations and p is the probability for the category. D.Goodness-of-fit hypothesis tests may be left-tailed, right-tailed, or two-tailed. | back 11 D.Goodness-of-fit hypothesis tests may be left-tailed, right-tailed, or two-tailed. |
front 12 In a test of homogeneity, which of the following is NOT true? A.If the chi squaredχ2 test statistic is large, the P-value will be small. B.The null hypothesis is that the different populations have the same proportions of some characteristics. C.Small values of the chi squaredχ2 test statistic would lead to a decision to reject the null hypothesis.This is the correct answer. D.Samples are drawn from different populations and we wish to determine whether these populations have the same proportions of the characteristics being considered. | back 12 C.Small values of the chi squaredχ2 test statistic would lead to a decision to reject the null hypothesis.This is the correct answer. |
front 13 A _____________ is used to test the hypothesis that an observed frequency distribution fits (or conforms to) some claimed distribution. | back 13 Goodness-of-fit Test |
front 14 In a ____________ we test the claim that different populations have the same proportions of some characteristics. | back 14 Test of Homogeneity |
front 15 Which of the following is NOT true of the χ2 test statistic? A.If the observed and expected frequencies are not close, the chi squaredχ2 test statistic will be large and the P-value will be small. B.A small chi squaredχ2 test statistic leads us to conclude that there is not a good fit with the assumed distribution.This is the correct answer. C.The chi squaredχ2 test statistic is based on differences between the observed and expected values. | back 15 B.A small chi squaredχ2 test statistic leads us to conclude that there is not a good fit with the assumed distribution.This is the correct answer. |
front 16 Which of the following is NOT a requirement of conducting a hypothesis test for independence between the row variable and column variable in a contingency table? A.For every cell in the contingency table, the observed frequency, O, is at least 5.This is the correct answer. B.For every cell in the contingency table, the expected frequency, E, is at least 5. C.The sample data are randomly selected. D.The sample data are represented as frequency counts in a two-way table. | back 16 A.For every cell in the contingency table, the observed frequency, O, is at least 5.This is the correct answer. |
front 17 The method of _______ is used for tests of hypotheses that three or more population means are equal. | back 17 One-Way Analysis of Variance |
front 18 Which of the following is NOT true of one-way analysis of variance experimental design? A.Using a rigorously controlled design is one way to reduce the effect of extraneous factors. B.Good results require that experiments be carefully designed and executed. C.In any design, if the conclusion is that the differences among the means are significant, the differences are explained by the factor used.This is the correct answer .D.A completely randomized experimental design is one way to reduce the effect of extraneous factors. | back 18 C.In any design, if the conclusion is that the differences among the means are significant, the differences are explained by the factor used.This is the correct answer |
front 19 A ____________ is a table in which frequencies correspond to two variables. | back 19 Contingency Table |
front 20 Which of the following is NOT a requirement for using one-way analysis of variance for testing equality of three of more population means? A.The samples are matched or paired in some way.This is the correct answer. B.The samples are simple random samples of quantitative data. C.The populations have distributions that are approximately normal. D.The different samples are from populations that are categorized in only one way. | back 20 A.The samples are matched or paired in some way.This is the correct answer. |
front 21 A _______ is a characteristic used in ANOVA that allows us to distinguish different populations from one another. | back 21 Treatment |
front 22 Which of the following is NOT true of the F test statistic? A.Fequals=StartFraction MS left parenthesis treatment right parenthesis Over MS left parenthesis error right parenthesis EndFractionMS(treatment)MS(error), when testing with unequal sample sizes B.The F test statistic is never negative. C.If the F test statistic is large, then the P-value will be large. This is the correct answer. D.Fequals=StartFraction left parenthesis variance between samples right parenthesis Over left parenthesis variance with samples right parenthesis EndFraction | back 22 C.If the F test statistic is large, then the P-value will be large. This is the correct answer. |
front 23 Which of the following is NOT true for conducting a hypothesis test for independence between the row variable and column variable in a contingency table? A.The number of degrees of freedom is (rminus−1)(cminus−1), where r is the number of rows and c is the number of columns. B.The null hypothesis is that the row and column variables are independent of each other. C.Small values of the chi squaredχ2 test statistic reflect significant differences between observed and expected frequencies.This is the correct answer. D.Tests of independence with a contingency table are always right-tailed. | back 23 C.Small values of the chi squaredχ2 test statistic reflect significant differences between observed and expected frequencies.This is the correct answer. |
front 24 Which of the following is NOT a procedure (either formal or informal) to use to identify the specific means that are different when the conclusion of a one-way ANOVA is that at least one of the population means is different? A.Utilize multiple comparison tests that make adjustments to overcome the problem of increasing the probability of a Type I error. B.Use a range test to identify subsets of means that are not significantly different from each other. C.Utilize Bayes' Theorem to differentiate at least one mean from the others.This is the correct answer. D.Construct boxplots of the data sets to see if one or more is significantly different from the others. | back 24 C.Utilize Bayes' Theorem to differentiate at least one mean from the others.This is the correct answer. |