Instructions for Side by Side Printing
- Print the notecards
- Fold each page in half along the solid vertical line
- Cut out the notecards by cutting along each horizontal dotted line
- Optional: Glue, tape or staple the ends of each notecard together
AP Stats Chi Square Multiple Choice
front 1  | back 1 C |
front 2  | back 2 C |
front 3  | back 3 B |
front 4  | back 4 D |
front 5  | back 5 D |
front 6 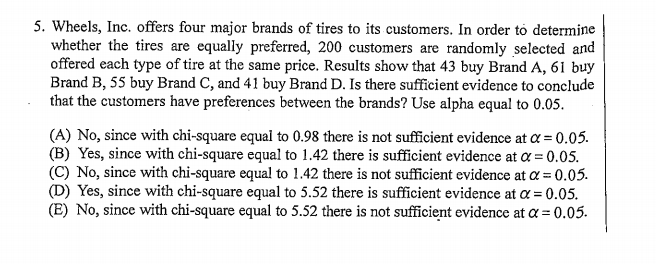 | back 6 E |
front 7 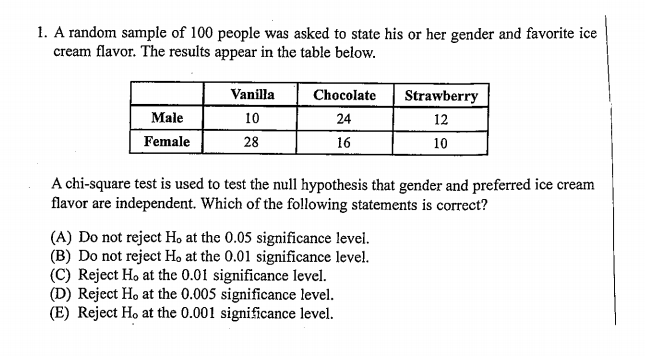 | back 7 C |
front 8 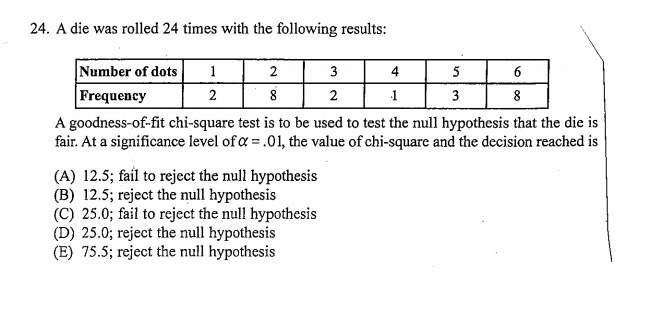 | back 8 A |
front 9 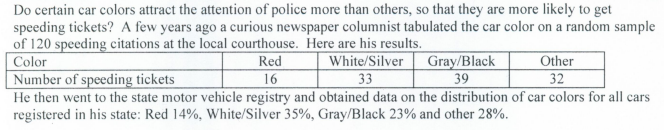 The appropriate null hypothesis is: A. The observed counts are all equal to 30. B. The observed number of speeding tickets is the same for all four color groups. C. At least one of the four car color percentages is different from the other three. D. The distribution of car colors for the speeding citations is the same as the distribution of colors for cars on the highway. E. The observed counts are equal to the expected counts. | back 9 D |
front 10  3. The chi-square statistic for this test is χ2 = 8.461 with 3 degrees of freedom, which yields a P-value of 0.037. Which of the following is an appropriate conclusion to draw? A. Accept H0 at the α = 0.10 level: there is evidence that certain car colors get more speeding tickets than others. B. Accept Ha at the α = 0.01 level: there is evidence that certain car colors get more speeding tickets than others. C. Accept Ha at the α = 0.01 level: we do not have sufficient evidence to conclude that certain car colors get more speeding tickets than others. D. Reject H0 at the α = 0.01 level: we do not have sufficient evidence to conclude that certain car colors get more speeding tickets than others. E. Reject H0 at the α = 0.05 level: there is evidence that certain car colors get more speeding tickets than others. | back 10 E |
front 11  Ida wants to know if males and females prefer different brands of ready-made chocolate-chip cookie dough. She bakes eight dozen cookies from dough made by each of four manufacturers which she labels brands A, B, C, and D. She then selects a simple random sample of 96 students, records their gender, gives them one cookie of each brand and asks which brand they like best. Here are her results: 9. The conditional distribution for preferred cookie brand among males (in percents) is given by which of the following? A. A: 27%; B: 19%; C: 25%; D: 29% B. A: 4%; B: 6%; C: 13%; D: 15% C. A: 11%; B: 16%; C: 34%; D: 39% D. A: 23%; B: 13%; C: 11%; D: 14% E. A: 38%; B: 21%; C: 19%; D: 22% | back 11 C |
front 12 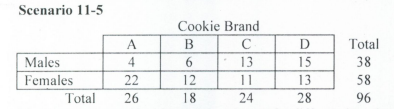 If we want to compare the conditional distributions for preferred cookie brand among males to the same distribution for females, which of the following is an appropriate graph to use? A. Parallel dotplots B. Back-to-back stemplots C. Segmented bar graphs D. Side-by-side histograms E. Scatterplot | back 12 D |
front 13  The appropriate null hypothesis for Ida’s question in this problem is: A. There is an association between gender and preferred cookie brand. B. Gender and cookie brand are independent. C. The distribution of preferred cookie brand for each gender is different. D. The observed count in each cell is equal to the expected count. E. The males and females subjects in this experiment have the same distribution of cookie brand preference | back 13 B |
front 14  The chi-square statistics for this test would have a χ2 distribution with how many degrees of freedom? A. 2 B. 3 C. 4 D. 6 E. 294 | back 14 A |
front 15  The conditional distribution of the variable “Wear Glasses” for Average readers (in percents) is: A. 15.7%; 16%; 10.3% B. 37.3%; 38.1%; 24.6% C. 48%; 78% D. 38.1%; 61.9% E. 16.0%; 26.0% | back 15 D |
front 16 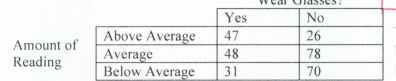 Suppose we wish to test the null hypothesis that there is no association between the amount of reading you do and whether or not you wear glasses. Under the null hypothesis, which of the following is the expected number (approximately) of above-average readers who wear glasses? A. 81.1 B. 47 C. 30.7 D. 27.2 E. 19.7 | back 16 C |
front 17  Suppose we wished to display in a graph the proportion of all above-average readers who wear glasses and do not wear glasses, respectively. Which of the following graphical displays is best suited to this purpose? A. A stemplot B. A scatterplot C. side-by-side histograms D. A bar graph E. A boxplot | back 17 D |
front 18 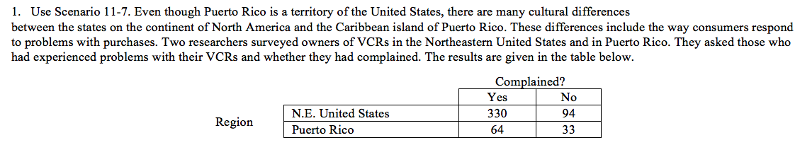 The cell that contributes most to the c2 statistic is A. Americans in the Northeastern United States who complained. B. Puerto Ricans who complained. C. Americans in the Northeastern United States who did not complain. D. Since the data form a 2 ´ 2 table, all cells contribute equally to the statistic. E. Puerto Ricans who did not complain. | back 18 A |
front 19 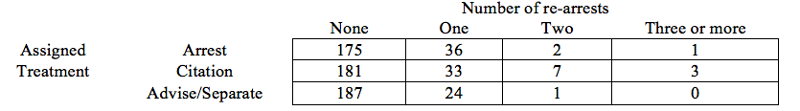 When a police officer responds to a call for help in a case of spousal abuse, what should the officer do? A randomized controlled experiment in Charlotte, North Carolina, studied three police responses to spousal abuse: advise and possibly separate the couple, issue a citation to the offender, and arrest the offender. The effectiveness of the three responses was determined by re-arrest rates. The table below shows these rates. Suppose we wish to test the null hypothesis that the proportion of subsequent arrests is the same regardless of the treatment assigned. Which of the following statements is true? A. We cannot test this hypothesis because this is an experiment, not a random sample. B. The test of the null hypothesis will have a very small P-value (below 0.0001) because there were so few cases where there was more than one re-arrest. C. We should eliminate the last column, since there are so few entries in that column. D. The test of the null hypothesis will have a very small P-value (below 0.0001) because the counts in each row are not identical. E. We cannot test this hypothesis because the expected cell counts are less than 5 in some of the cells. | back 19 E |
front 20 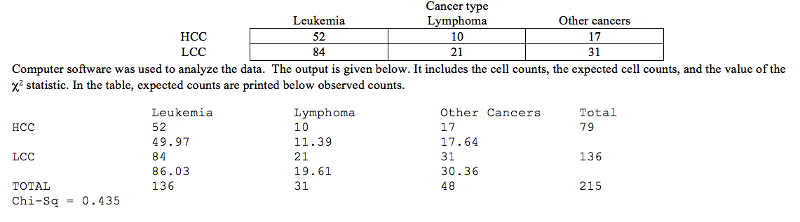 Which of the following intervals contains the P-value of the test? A. Between 0.05 and 0.10. B. between 0.01 and 0.05. C. between 0.10 and 0.20. D. less than 0.01. E. larger than 0.20. | back 20 E |
front 21  The appropriate degrees of freedom for the c2 statistic is A. 2. B. 5. C. 1. D. 4. E. 3. | back 21 A |
front 22  Which of the following may we conclude, based on the test results? A. There is weak evidence that HCC causes cancer in children. B. There is not much evidence of an association between wiring configuration and the type of cancer that caused the deaths of children in the study. C. Leukemia is the most common type of cancer among children. D. HCC either causes cancer directly or is a major contributing factor to the development of cancer in children. E. There is strong evidence of an association between wiring configuration and the chance a child will develop some form of cancer. | back 22 B |
front 23 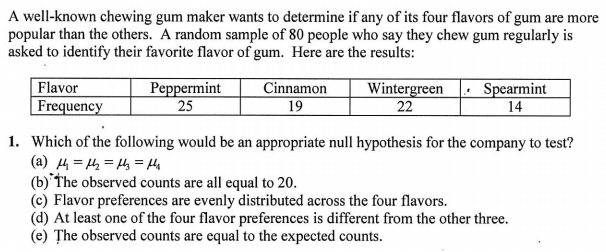 | back 23 C |
front 24  | back 24 B |
front 25  | back 25 B |
front 26 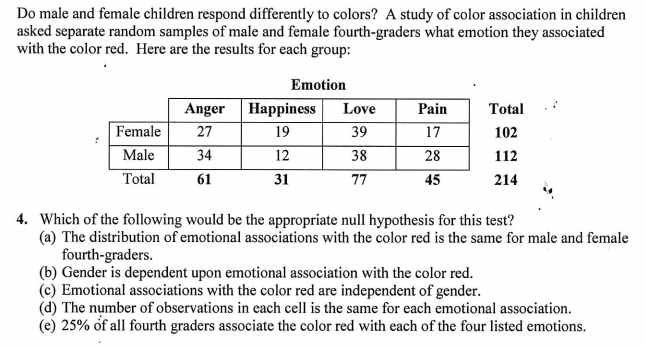 | back 26 A |
front 27 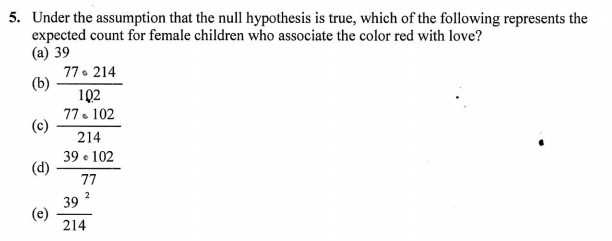 | back 27 C |
front 28 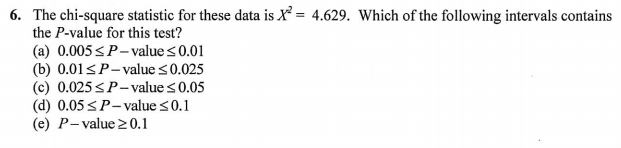 | back 28 E |
front 29 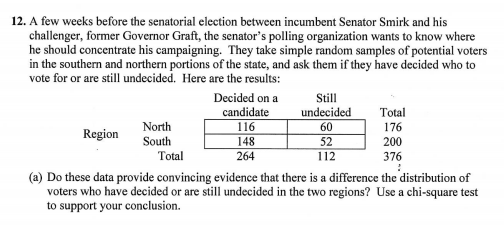 | back 29 x = 2.93 p = 0.087 dF = 1 |
front 30  | back 30 Yes. If we assume that all 24 non-responders decided on a candidate it would not change conclusions. However, if all 24 people were still undecided, x = 11.4 and p = 0.0007, which provides convincing evidence that there is a difference. |