Instructions for Side by Side Printing
- Print the notecards
- Fold each page in half along the solid vertical line
- Cut out the notecards by cutting along each horizontal dotted line
- Optional: Glue, tape or staple the ends of each notecard together
Chp.53
front 1 _______ _______ is the study of populations in relation to environment, including environmental influences on density and distribution, age structure, and population size. | back 1 Population ecology |
front 2 A _________ is a group of individuals of a single species living in the same general area. | back 2 population |
front 3 _________ is the number of individuals per unit area or volume. | back 3 Density |
front 4 __________ is the pattern of spacing among individuals within the boundaries of the population. | back 4 Disperson |
front 5 The _________ ________ of a population refers to the way individuals are spaced within their area. They can be clumped, uniform, and random. | back 5 dispersion pattern |
front 6 __________ is the study of the vital statistics of a population and how they change over time. | back 6 Demography |
front 7 a _______ ________ is an age-specific summary of the survival pattern of a population. | back 7 life table |
front 8 _________ _______ plot the proportion of individuals alive at each age. | back 8 survivorship curves |
front 9 Type ___: low death rates during early and middle life, then an increase in death rates among older age groups. | back 9 1 |
front 10 Type ___: the death rate is constant over the organisms's life span. | back 10 2 |
front 11 Type ___: high death rates for the young, then a slower death rate for survivors. | back 11 3 |
front 12 __________ growth model: the rate of population increases under ideal conditions, and cannot be sustained for long in any population. | back 12 Exponential |
front 13 ________ growth model: this growth model takes into account limiting factors, environmental factors that restrict population growth. | back 13 Logistic |
front 14 __-selection, or density-dependent selection, selects for life history traits that maximize reproduction. | back 14 K |
front 15 __-selection, or density-inependent selection, selects for life history traits that maximize reproduction. | back 15 r |
front 16 In density-___________ populations, birth rate and death rate do not change with population density. | back 16 independent |
front 17 In density-__________ populations, birth rates fall and death rates rise with population density. | back 17 dependent |
front 18 the study of ________ ________ focuses on the complex interactions between biotic and abiotic factors that cause variation in population size. | back 18 population dynamics |
front 19 ___________ are groups of populations linked by immigration and emigration. | back 19 Metapopulations |
front 20 The _________ _________ concept summarizes the aggregate land and water area needed to sustain the people of a nation. | back 20 ecological footprint |
front 21 Population ecologists are primarily interested in | back 21 Answer: B |
front 22 A population is correctly defined as having which of the following characteristics? I. inhabiting the same general area A) I only | back 22 Answer: C |
front 23 An ecologist recorded 12 white-tailed deer, Odocoileus virginianus,
per square mile in one woodlot and 20 per square mile in another
woodlot. What was the ecologist comparing? | back 23 Answer: A |
front 24 During the spring, you are studying the mice that live in a field
near your home. The population density is high, but you realize that
you rarely observe any reproductive female mice. This most likely
indicates | back 24 Answer: D |
front 25 Uniform spacing patterns in plants such as the creosote bush are most
often associated with | back 25 Answer: D |
front 26 To construct a reproductive table for a sexual species, one needs to
| back 26 Answer: C |
front 27 Which of the following sets of measurements is the most useful when
studying populations? | back 27 Answer: A |
front 28 Which of the following scenarios would provide the most legitimate
data on population density? | back 28 Answer: B |
front 29 Which of the following best defines a cohort? | back 29 Answer: D |
front 30 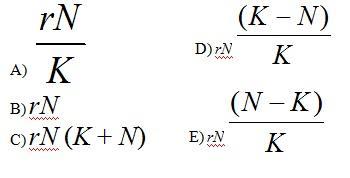 Exponential growth of a population is represented by dN/dt = A. SEE IMAGE | back 30 Answer: B |
front 31 Starting from a single individual, what is the size of a population
of bacteria that reproduce by binary fission every 20 minutes at the
end of a 2-hour time period? (Assume unlimited resources and no
mortality.) | back 31 Answer: D |
front 32 Which of the following is the equation for zero population
growth (ZPG)? | back 32 Answer: A |
front 33 In July 2008, the United States had a population of approximately
302,000,000 people. How many Americans were there in July 2009, if the
estimated 2008 growth rate was 0.88%? | back 33 Answer: D |
front 34 In 2008, the population of New Zealand was approximately 4,275,000
people. If the birth rate was 14 births for every 1,000 people,
approximately how many births occurred in New Zealand in 2008?
| back 34 Answer: C |
front 35  Logistic growth of a population is represented by dN/dt = A. SEE IMAGE | back 35 Answer: D |
front 36 As N approaches K for a certain population, which of the following is
predicted by the logistic equation? | back 36 Answer: B |
front 37 In models of logistic population growth, | back 37 Answer: A |
front 38 Carrying capacity is | back 38 Answer: B |
front 39 Which of the following causes populations to shift most quickly from
an exponential to a logistic population growth? | back 39 Answer: D |
front 40 Which of the following statements about the evolution of life
histories is correct? | back 40 Answer: C |
front 41 Which of the following is characteristic of K-selected populations?
| back 41 Answer: A |
front 42 Which of the following is most likely to contribute to
density-dependent regulation of populations? | back 42 Answer: B |
front 43 Why do populations grow more slowly as they approach their carrying
capacity? | back 43 Answer: A |
front 44 Which of the following could be a
density-independent factor limiting human population
growth? | back 44 Answer: B |
front 45 An ecological footprint is a construct that is
useful | back 45 Answer: A |
front 46  Which statement best explains survivorship curve B? | back 46 Answer: E |
front 47 A population's carrying capacity | back 47 Answer: A |
front 48 During exponential growth, a population always | back 48 Answer: B |
front 49 Why do some invertebrates, such as lobsters, show a
"stair-step" survivorship curve? | back 49 Answer: C |
front 50 Consider two forests: one is an undisturbed old-growth forest, while
the other has recently been logged. In which forest are species likely
to experience exponential growth, and why? | back 50 Answer: C |
front 51 Natural selection involves energetic trade-offs between | back 51 Answer: E |
front 52 In which of the following situations would you expect to find the
largest number of K-selected individuals? | back 52 Answer: C |
front 53 Which of the following was the most significant limiting factor in
human population growth in the 20th century? | back 53 Answer: E |
front 54 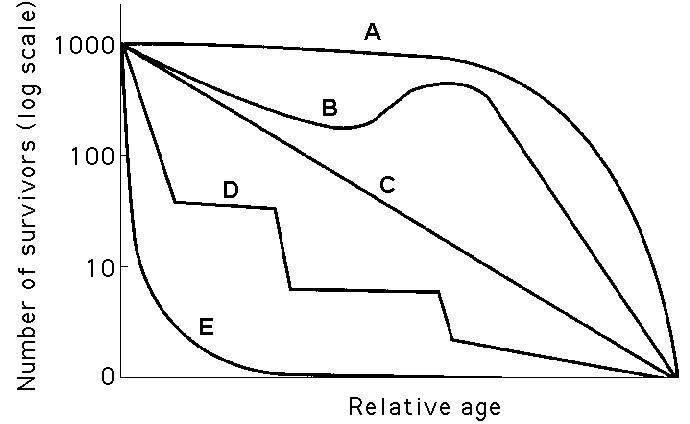 Which curve best describes survivorship in marine molluscs? | back 54 Answer: E |
front 55  Which curve best describes survivorship in elephants? | back 55 Answer: A |
front 56  Which curve best describes survivorship in a marine crustacean that
molts? | back 56 Answer: D |
front 57  Which curve best describes survivorship in humans who live in
undeveloped nations? | back 57 Answer: A |
front 58 Population ecologists follow the fate of same-age cohorts to | back 58 Answer: B |
front 59 A recent study of ecological footprints concluded that | back 59 Answer: E |
front 60 The observation that members of a population are uniformly
distributed suggests that | back 60 Answer: C |
front 61 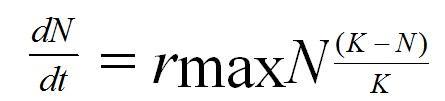 According to the logistic growth equation SEE IMAGE A) the number of individuals added per unit time is greatest when N
is close to zero. | back 61 Answer: C |
front 62 Which of the following statements about human population in
industrialized countries is incorrect? | back 62 Answer: A |