Instructions for Side by Side Printing
- Print the notecards
- Fold each page in half along the solid vertical line
- Cut out the notecards by cutting along each horizontal dotted line
- Optional: Glue, tape or staple the ends of each notecard together
General Statistics: Ch 3 Test
front 1 Suppose that all the values in a data set are converted to z-scores. Which of the statements below istrue? | back 1 The mean of the z-scores will be 0, and the standard deviation of the z-scores will be 1. |
front 2 Find all measures of center: A store manager kept track of the number of newspapers sold each week over a randomly selected seven-week period. The results are shown below. 80 39 214 152 264 239 232 Find the median number of newspapers sold. | back 2 Mean: x̄ = 174.3 newspapers Median: x(~) = 214.0 newspapers Midrange: 151.5 Mode: none |
front 3 Which is better: A score of 82 on a test with a mean of 70 and a standard deviation of 8, or a score of 82 on a test with a mean of 75 and a standard deviation of 4? | back 3 The second 82 (82 – 70) ÷ 8 (82 – 75) ÷ 4 = 1.5 = 1.75 |
front 4 A department store, on average, has daily sales of $29,876.76. The standard deviation of sales is $1000.On Tuesday, the store sold $34,893.71 worth of goods. Find Tuesday's z score. Was Tuesday an unusually good day? | back 4 5.02, yes (34,893.71 – 29,876.76) ÷ 1000 = 5.01695 |
front 5 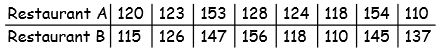 Find the range, variance, and standard deviation for each of the two samples, then compare the two sets of results: When investigating times required for drive-through service, the following results (in seconds) were obtained. | back 5 Restaurant A: 44 sec; s2 = 260.8 sec2; s = 16.1 sec Restaurant B: 46 sec; s2 = 285.6 sec2; s = 16.9 sec There is more variation in the times for restaurant B. |
front 6 Find the z-score corresponding to the given value and use the z-score to determine whether the value is unusual. A time for the 100 meter sprint of 21.3 seconds at a school where the mean time for the 100 meter sprint is 17.5 seconds and the standard deviation is 2.1 seconds. | back 6 1.80; not unusual (21.3 – 17.5) ÷ 2.1 = 1.80952381 |
front 7 Use the given sample data to find Q3: 49 52 52 52 74 67 55 55 | back 7 61.0 |
front 8 The weekly salaries (in dollars) of 24 randomly selected employees of a company are shown below. Construct a boxplot for the data set. 310 320 450 460 470 500 520 540 580 600 650 700 710 840 870 900 1000 1200 1250 1300 1400 1720 2500 3700 | back 8 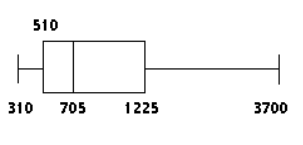 The 5-number summary is 310, 510, 705, 1225, 3700 |
front 9 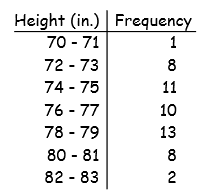 The heights of a group of professional basketball players are summarized in the frequency distribution below. Find the mean height. | back 9 x̄ = 76.7 in. (Use calculator) L1 L2 midpt freq 1–Var Stats L1,L2 mean = 76.68867925 |
front 10 The systolic blood pressure of 18-year-old women is normally distributed with a mean of 120 mmHg and a standard deviation of 12 mmHg. What percentage of 18-year-old women have a systolic blood pressure between 96 mmHg and 144 mmHg? | back 10 95% (96 – 120) ÷ 12 (144 – 120) ÷ 12 = -2SD = 2SD 2SD = 95% |