Instructions for Side by Side Printing
- Print the notecards
- Fold each page in half along the solid vertical line
- Cut out the notecards by cutting along each horizontal dotted line
- Optional: Glue, tape or staple the ends of each notecard together
General Statistics: Ch 2 Test
front 1 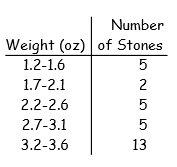 Construct the cumulative frequency distribution that corresponds to the given frequency distribution. | back 1 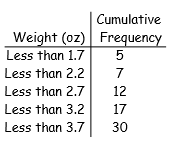 5 (+5) 7 (5 + 2) 12 (5 + 2 + 5) 17 (5 + 2 + 5+ 5) 30 (5 + 2 + 5 + 5 + 13) |
front 2 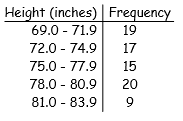 Construct the cumulative frequency distribution that corresponds to the given frequency distribution. | back 2 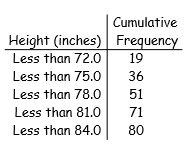 19 (+19) 36 (19 + 17) 51 (19 + 17 + 15) 71 (19 + 17 + 15 + 20) 80 (19 + 17 + 15 + 20 + 9) |
front 3 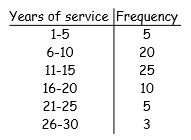 Provide an appropriate response. The frequency distribution below summarizes employee years of service for Alpha Corporation. Find the class boundaries for class 26-30. | back 3 25.5, 30.5 |
front 4 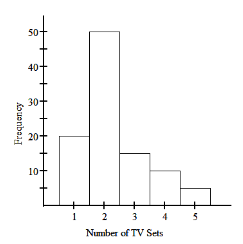 Provide an appropriate response. The histogram below represents the number of television sets per household for a sample of U.S.households. How many households are included in the histogram? | back 4 100 sum total of frequencies = (20 + 50 + 15 + 10 + 5) |
front 5 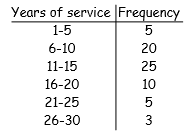 Provide an appropriate response. The frequency distribution below summarizes employee years of service for Alpha Corporation. Find the class midpoint for class 1-5. | back 5 3.0 midpoint = (1 + 5) ÷ 2 = 3.0 |
front 6 Provide an appropriate response. Sturges' guideline suggests that when constructing a frequency distribution, the ideal number of classes can be approximated by 1 + (log n)/(log 2), where n is the number of data values. Use this guideline to find the ideal number of classes when the number of data values is 146. | back 6 8 1 + ( log(146) ) ÷ ( log(2) ) = 8.2 |
front 7 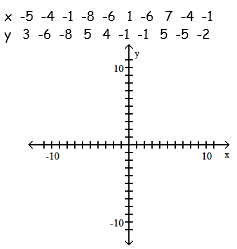 Use the given paired data to construct a scatterplot. | back 7 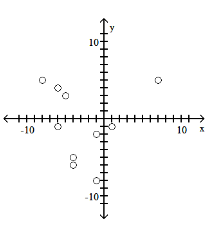 |
front 8 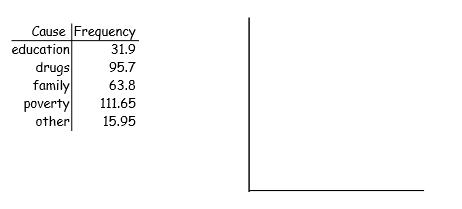 Solve the problem. At the National Criminologists Association's annual convention, participants filled out a questionnaire asking what they thought was the most important cause for criminal behavior. The tally was as follows. Construct a Pareto chart to display these findings. | back 8 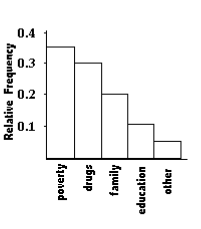 |
front 9 Construct the dotplot for the given data. A store manager counts the number of customers who make a purchase in his store each day. The data are as follows. 15 16 13 19 12 15 15 16 13 12 | back 9 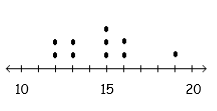 |
front 10 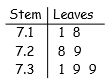 Find the original data from the stemplot. | back 10 7.11, 7.18, 7.28, 7.29, 7.31, 7.39, 7.39 |