Instructions for Side by Side Printing
- Print the notecards
- Fold each page in half along the solid vertical line
- Cut out the notecards by cutting along each horizontal dotted line
- Optional: Glue, tape or staple the ends of each notecard together
Microbiology Lab Experiments- Exercise 20
front 1 The effect of temperature can be determined by measuring the _________________________. | back 1 population growth rate |
front 2 When they speak of "air" as a growth requirement what do they mean? | back 2 they are referring to the oxygen in air |
front 3 When they refer to oxygen they mean _______________. | back 3 molecular oxygen that acts as an electron acceptor in aerobic respiration. |
front 4 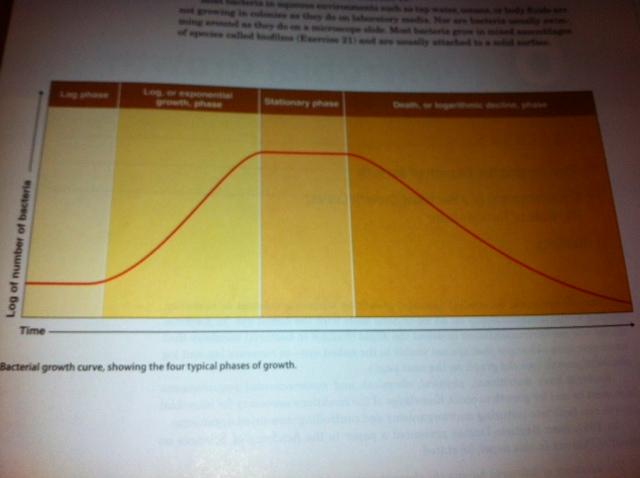 What is the an image of? | back 4 bacterial growth rate |
front 5 During log phase the cells are growing at ____________________________. | back 5 Fastest rate possible under the conditions provided |
front 6 What is generation or doubling time? | back 6 The time it takes for one cell to divide into 2 cells or the time required for the population of cells to double. |
front 7 The shorter the generation time the ___________ the growth. | back 7 faster |
front 8 Turbidity can be measured with a ______________. | back 8 spectrophotometer to determine growth |
front 9 True or false. Although turbidity is not a direct measure of bacterial numbers, increasing turbidity does indicate growth. | back 9 true |
front 10 Changes in the logarithmic absorbance scale on the spectrophotometer correspond to changes in ______________________________. | back 10 The number of cells |
front 11 A growth curve can be obtained by graphing absorbance (Y-axis)vs. time (X-axis). The rate of growth is indicated by the ____________ of the lines, faster growth produces a steeper (higher number) slope. | back 11 slope |
front 12 What is the minimum growth temperature? | back 12 the lowest temperature at which a species will grow |
front 13 A species grows fastest at its ___________________? | back 13 optimum growth temperature |
front 14 The highest temperature at which a species will grow is its ____________________________. | back 14 maximum growth temperature |
front 15 At temperatures near the maximum growth temperature, growth ceases, presumably because of the ______________________________. | back 15 denaturation of enzymes |
front 16 Increasing temperature optimizes or lowers the growth of the bacteria? | back 16 lowers |
front 17 At what temperature would you expect E-coli to grow best? | back 17 35 degrees Celsius |
front 18 Define the optimal growth temperature for each of the following classes of bacteria... | back 18 hyperthermophile 80 and above, Thermophile between 50 and 80. Mesophile between 20 and 50. Psychrophile -5 to 20. |
front 19 What is the optimum growth temperature for most human pathogens? | back 19 37* is the optimum temperature for most pathogens because that is human body temperature. |