Instructions for Side by Side Printing
- Print the notecards
- Fold each page in half along the solid vertical line
- Cut out the notecards by cutting along each horizontal dotted line
- Optional: Glue, tape or staple the ends of each notecard together
ECON 142 Final
front 1 In economics, decisions are necessary because ________ are scarce, while ________ are practically unlimited. | back 1 resources; wants and needs |
front 2 Microeconomics is the branch of economics that focuses on the | back 2 choices and decision making of individuals and firms. |
front 3 Incentives are commonly classified as | back 3 positive or negative. |
front 4 A father takes his daughter on an outing and promises her pizza if she behaves. In addition, he warns her that if she misbehaves, she won’t be allowed to go to a sleepover that evening. The latter is an example of a(n) ________ incentive and reinforces the impact of the pizza, a(n) ________ incentive. | back 4 negative; positive |
front 5 Rational decision making under conditions of scarcity requires individuals to | back 5 understand that trade-offs are necessary. |
front 6 Opportunity cost is the ________ alternative sacrificed when a choice is made. | back 6 highest-valued |
front 7 Ishmael has four potential jobs to consider, each with different salary offers. From highest to lowest, the salaries are: $58,500, $57,000, $56,000, and $53,000. Based on the information provided, what is the opportunity cost of Ishmael accepting the position that pays $56,000? | back 7 $58,500 |
front 8 Why is voluntary trade a good thing, from an economic perspective? | back 8 Trade creates value for all parties involved. |
front 9 The term ________ means “additional.” | back 9 marginal |
front 10 According to marginal thinking, an individual will stop buying more of a good when the ________ of the next unit exceeds the ________. | back 10 cost; benefit |
front 11 For a market to be competitive | back 11 each buyer and seller is small relative to the whole market; no single decision maker has any influence over the market price. |
front 12 A decrease in demand is represented by a | back 12 shift of the demand curve to the left. |
front 13 Something is a normal good if the demand for the good | back 13 increases as the consumer’s income increases. |
front 14 If good A and good B are substitutes, a price increase for good A will ____ the demand for good B. | back 14 increase |
front 15 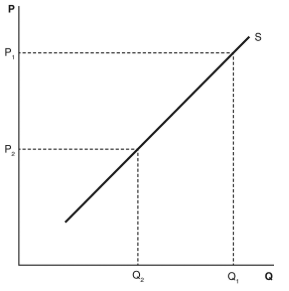 Refer to the accompanying graph. When the price changes from P1 to P2, we will see a(n) | back 15 decrease in quantity supplied from Q1 to Q2 |
front 16 Which of the following will cause a movement along a good’s supply curve? | back 16 The price of the good increases |
front 17 When the number of firms in a market decreases, generally | back 17 the supply curve shifts to the left. |
front 18 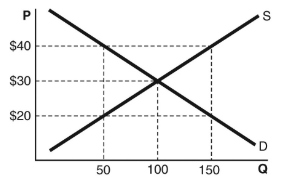 Which of the quantity (Q) and price (P) combinations in the accompanying graph represents the market at competitive equilibrium? | back 18 (100, $30) |
front 19 According to the accompanying graph, if the price is $20, there is a ________ of ________ units. | back 19 shortage; 100 ` |
front 20 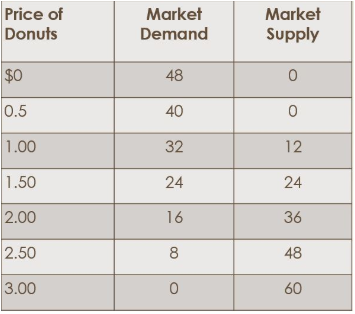 Consider the table below that shows the supply and demand for the donut market. How do you know what the equilibrium price of donuts is? | back 20 The equilibrium price occurs where Qd=Qs. |
front 21 What is true when the price in this market is equal to $2.50? | back 21 There is a surplus of donuts equal to 40 donuts. |
front 22 If the number of buyers in a market increases from 50 to 100, you would expect the equilibrium price (P*) to ________ and quantity (Q*) to ________, holding all else constant. | back 22 increase; increase |
front 23 The difference between a tax and a subsidy is when the government places a tax on the producers of a good, it ________ the equilibrium price (P*) and ________ the equilibrium quantity (Q*), but when the government grants a subsidy to the producers of the good, it ________ the equilibrium price (P*) and ________ the equilibrium quantity (Q*). | back 23 increases; decreases; decreases; increases |
front 24 In the market for computers, two effects occur simultaneously. Computers have become more commonly used every day, and technology has improved, making them easier to produce. What are the effects on the equilibrium price (P*) and quantity (Q*)? | back 24 Q* increases, and the effect on P* is ambiguous. |
front 25 Consider the market for donuts, and suppose two things happen simultaneously:
What are the effects on the equilibrium price (P*) and quantity (Q*) for donuts? | back 25 Q* decreases, and the effect on P* is ambiguous. |
front 26 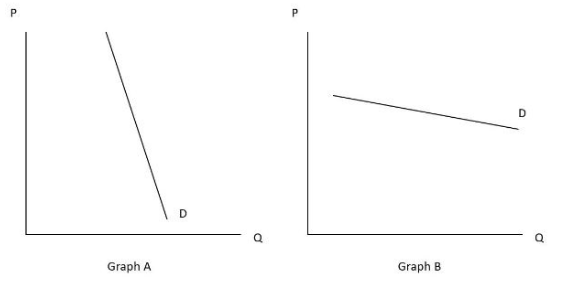 The price elasticity of demand for bubble gum is -4. Demand for bubble gum is considered _____, and Graph _____ is more likely to represent that demand curve (see graphs below to answer the question). | back 26 Elastic; B |
front 27 For a good, imagine that price increases by 2 percent and quantity demanded decreases by 1 percent. What is the price elasticity of demand? | back 27 -0.5 |
front 28 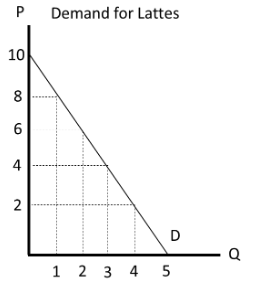 Using the midpoint formula, what is the price elasticity of demand over the segment between P=4 and P=6? Round to two decimal points, if necessary. | back 28 -1 |
front 29 The sign and absolute value for the cross-price elasticity of demand helps us to determine whether two products are | back 29 substitutes or complements. |
front 30 A good that has more substitutes has more _____ price elasticity of demand. | back 30 elastic |
front 31 Income elasticity of demand is ____ for a normal good and ____ for an inferior good. | back 31 positive; negative |
front 32 Which good is most likely to have an income elasticity of demand equal to –0.2? | back 32 used clothing |
front 33 When the price increases and the demand curve is INELASTIC, we expect quantity demanded to ___ and total revenue to ____. | back 33 decrease by a small amount; increase |
front 34 A perfectly elastic supply curve | back 34 is horizontal. |
front 35 Over time, the price elasticity of supply for sunglasses will become more | back 35 elastic. |
front 36 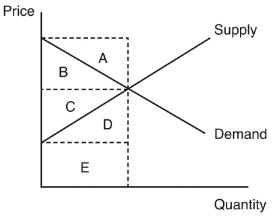 In the above graph, which region represents the consumer surplus? | back 36 Area B |
front 37 In the above graph, which area represents the producer surplus? | back 37 Area C |
front 38 In the above graph, which combination of areas represents the social welfare? | back 38 B + C |
front 39 Holding all else constant, when the price of a good increases, | back 39 consumer surplus decreases, and producer surplus increases. |
front 40 Social welfare (i.e., the sum of producer and consumer surplus) is maximized when | back 40 the market reaches its equilibrium price and quantity. |
front 41 The difference between the price consumers pay and the price sellers receive after a tax is imposed is equal to the | back 41 dollar amount of the tax. |
front 42 The incidence of a tax reflects | back 42 who bears the burden of the tax. |
front 43 If a tax is imposed on a good with equally elastic supply and demand, the burden of the tax will be borne | back 43 by consumers and producers equally. |
front 44 When a good with a perfectly inelastic demand is taxed, the incidence of the tax is borne | back 44 entirely by consumers. |
front 45 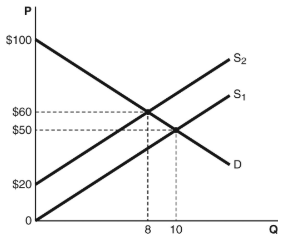 Based on the graph above, what is the total consumer surplus after a tax of $20 per unit is imposed on sellers? | back 45 $160 |
front 46 Based on the graph above, what is the total deadweight loss when a tax of $20 per unit is imposed on sellers? | back 46 $20 |
front 47 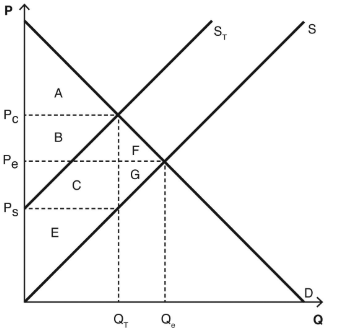
The following graph depicts a market where a tax has been imposed.
P e was the equilibrium price before
the tax was imposed, and Q e was
the equilibrium quantity. After the tax, P
C is the price consumers pay, and P
S is the price producers receive. Q
T units are sold after the tax is
imposed. Which area(s) represent producer surplus before the tax is imposed? | back 47 E + C + G |
front 48
The following graph depicts a market where a tax has been imposed.
P e was the equilibrium price before
the tax was imposed, and Q e was
the equilibrium quantity. After the tax, P
C is the price consumers pay, and P
S is the price producers receive. Q
T units are sold after the tax is
imposed. Which area(s) represent producer surplus after the tax is imposed? Assume Pc – Ps = Ps. | back 48 E |
front 49
The following graph depicts a market where a tax has been imposed.
P e was the equilibrium price before
the tax was imposed, and Q e was
the equilibrium quantity. After the tax, P
C is the price consumers pay, and P
S is the price producers receive. Q
T units are sold after the tax is
imposed. What is the amount of the tax, as measured along the y-axis? | back 49 PC - PS |
front 50
The following graph depicts a market where a tax has been imposed.
P e was the equilibrium price before
the tax was imposed, and Q e was the
equilibrium quantity. After the tax, P C
is the price consumers pay, and P S
is the price producers receive. Q T
units are sold after the tax is imposed. Which area(s) represent the revenue collected from this tax? | back 50 B + C |
front 51 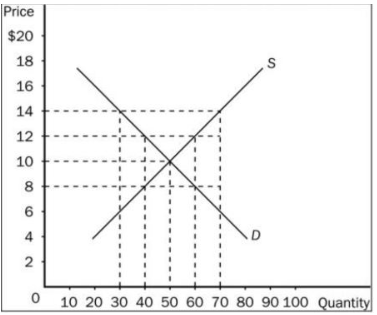 According to the graph shown, a binding price ceiling would exist at a price of | back 51 $8 |
front 52 At the binding price ceiling what would happen? | back 52 A shortage of 20 units |
front 53 According to the graph shown, a binding price floor would exist at a price of | back 53 $14 |
front 54 If a price ceiling is imposed at $15 per unit when the equilibrium market price is $12, in the long run, there will be | back 54 no surplus or shortage. |
front 55 Market for TVs: Demand: Q d = 2,600 – 5P Supply: Q s =–1,000 + 10P What would be the quantity demanded and the quantity supplied if a price ceiling is set at $200? | back 55 1,600; 1,000 |
front 56 What is the long-run consequence of a price floor law? | back 56 A surplus will continue to exist and will grow larger over time |
front 57 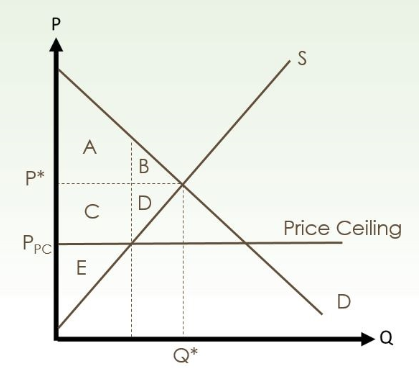 Consider the graph. Which area(s) represent(s) CONSUMER surplus after the price ceiling is imposed? | back 57 A+C |
front 58 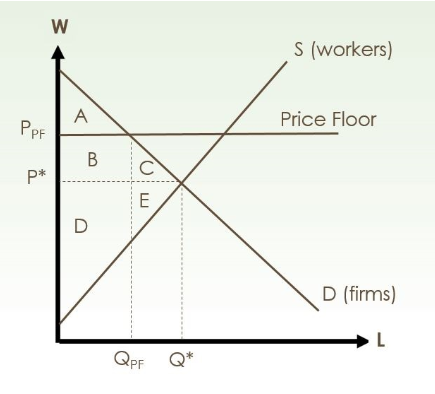 In our minimum wage example (a price floor), what happens to consumer surplus when the minimum wage is instituted? The figure below may help you answer this question. | back 58 It decreases overall |
front 59 Apartment rent control in New York City is an example of | back 59 a binding price ceiling. |
front 60 Assume that a firm's demand for labor in very inelastic. What does this mean for the number of people that will lose their job when a minimum wage in instituted? | back 60 The number of job losses will be small because it is difficult for firms to find substitutes for labor |
front 61 Assume a production possibilities frontier (PPF) with two goods in a country. A production allocation point that lies on the PPF line itself is a production point | back 61 that is using all of its resources efficiently |
front 62 One has an absolute advantage in producing something when | back 62 one can produce more of it than someone else using the same quantity of resources. |
front 63 To determine which of two producers has a comparative advantage, one would need to know their | back 63 opportunity costs of production for both goods. |
front 64 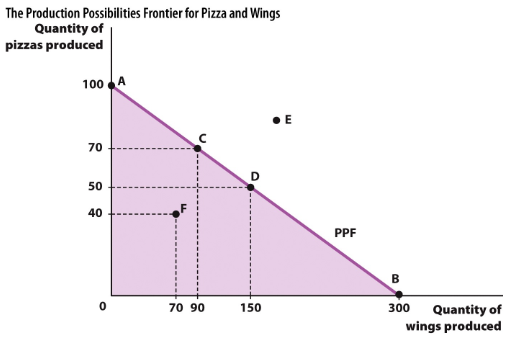 Based on the figure below, what would be the opportunity cost of producing 20 more pizzas (i.e. the number of wings that must be given up) if the economy is currently efficiently producing 150 wings and 50 pizzas? | back 64 60 wings |
front 65 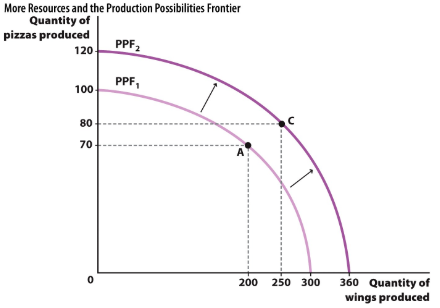 The graph below illustrates the effect on the production possibilities frontier if the population grows, making more workers available. This new production possibilities frontier reflects the ability of society to | back 65 produce both more wings and more pizza. |
front 66 Imagine that country A produces pens and scissors. If it dedicates all of it's resources to pens, it can produce 1000 pens. If country A dedicates all of it's resources to scissors, it can produce 3000 scissors. How many pens does Country A have to give up to produce 1500 scissors? | back 66 500 |
front 67 Imagine there are two countries: A and B. These countries have the same amount of resources and both produce two goods, pens and scissors. If country A dedicates all of its resources to pens, it can produce 1000 pens. If country A dedicates all of its resources to scissors, it can produce 3000 scissors. If country B dedicates all of its resources to pens, it can produce 500 pens. If country B dedicates all of its resources to scissors, it can produce 1000 scissors. What is true about the absolute advantage between these two countries? | back 67 Country A has an absolute advantage in both goods |
front 68 Imagine there are two countries: A and B. These countries have the same amount of resources and both produce two goods, pens and scissors. If country A dedicates all of its resources to pens, it can produce 1000 pens. If country A dedicates all of its resources to scissors, it can produce 3000 scissors. If country B dedicates all of its resources to pens, it can produce 500 pens. If country B dedicates all of its resources to scissors, it can produce 1000 scissors. What is true about the comparative advantage between these two countries? | back 68 Country A has a comparative advantage in scissors, Country B in pens |
front 69 Imagine there are two countries: A and B. These countries have the same amount of resources and both produce two goods, pens and scissors. If country A dedicates all of its resources to pens, it can produce 1000 pens. If country A dedicates all of its resources to scissors, it can produce 3000 scissors. If country B dedicates all of its resources to pens, it can produce 500 pens. If country B dedicates all of its resources to scissors, it can produce 1000 scissors. Which of these countries would accept and/or not accept a trade of 100 pens for 100 scissors (i.e. the trade would benefit them)? | back 69 Country A would accept this trade and Country B would not accept this trade |
front 70 Imagine there are two countries: A and B. These countries have the same amount of resources and both produce two goods, pens and scissors. If country A dedicates all of its resources to pens, it can produce 1000 pens. If country A dedicates all of its resources to scissors, it can produce 3000 scissors. If country B dedicates all of its resources to pens, it can produce 500 pens. If country B dedicates all of its resources to scissors, it can produce 1000 scissors. Now try a different terms of trade. Which of these countries would accept and/or not accept a trade of 200 pens for 500 scissors (i.e. the trade would benefit them)? | back 70 Both Country A and Country B would accept this trade |
front 71 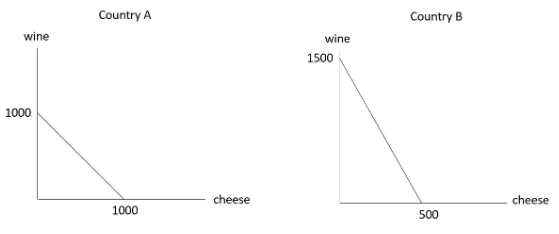 Consider the PPFs below to answer the following question. Which country has an absolute advantage in which good? | back 71 Country B has an absolute advantage in wine, Country A in cheese |
front 72 Consider the PPFs below to answer the following question. Which country has a comparative advantage in which good? | back 72 Country A has a comparative advantage in cheese; Country B has a comparative advantage in wine |
front 73 Consider the PPFs below to answer the following question. Which of these countries would accept and/or not accept a trade of 200 wine for 100 cheese (i.e. the trade would benefit them)? | back 73 Both Country A and Country B would accept this trade |
front 74 Consider the PPFs below to answer the following question. Now try a different terms of trade. Which of these countries would accept and/or not accept a trade of 400 wines for 100 cheese (i.e. the trade would benefit them)? | back 74 Country A would accept this trade and Country B would not accept this trade |
front 75 Specialization and trade allow individuals to | back 75 consume outside their own production possibilities frontiers (PPFs). |
front 76 Implicit costs are | back 76 also opportunity costs. |
front 77 Donna owns a small custom upholstery business. Her total revenue last year was $270,000, and her rent was $9,000 per month. She pays her one employee $3,000 per month, and the cost of materials and overhead averages $800 per month. Donna could earn $85,000 per year as the manager of a competing business nearby. Her explicit costs last year were | back 77 $153,600. |
front 78 When a firm hires another employee and, as a result, total output increases, this change in total output is also known as | back 78 marginal product. |
front 79 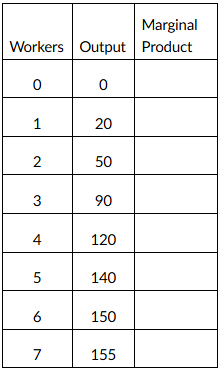 Nimbus, Inc., makes brooms and then sells them door-to-door. Here is the relationship between the number of workers and Nimbus's output on a given day. After which worker does marginal product begin diminishing? | back 79 3rd |
front 80 As a firm hires more labor and each worker is able to specialize, what happens to workers’ marginal productivity? | back 80 It increases at first, then decreases |
front 81 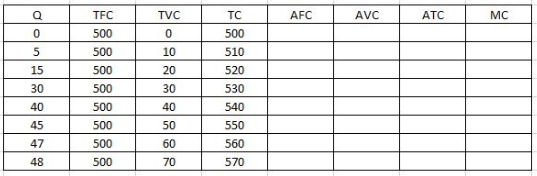 What is the value of the average fixed costs (AFC) when Q is equal to 40? Enter the number below. Do not include a dollar sign. You will not need to round, but you may need to include one digit after the decimal point. | back 81 12.5 |
front 82 What is the value of the average variable costs (AVC) when Q is equal to 40? Enter the number below. Do not include a dollar sign. You will not need to round, but you may need to include one digit after the decimal point. | back 82 1.0 |
front 83 What is the value of the average total costs (ATC) when Q is equal to 40? Enter the number below. Do not include a dollar sign. You will not need to round, but you may need to include one digit after the decimal point. | back 83 13.5 |
front 84 What is the value of the marginal cost (MC) when Q is equal to 40? Enter the number below. Do not include a dollar sign. You will not need to round, but you may need to include one digit after the decimal point. | back 84 1.0 |
front 85 What is true about the relationship between the average variable cost (AVC) and the average total cost (ATC)? | back 85 ATC is always greater than or equal to the AVC |
front 86 What is the value of the average fixed costs (AFC) when Q is equal to 5? Enter the number below. Do not include a dollar sign. You will not need to round, but you may need to include one digit after the decimal point. | back 86 100.0 |
front 87 What is the value of the average variable costs (AVC) when Q is equal to 5? Enter the number below. Do not include a dollar sign. You will not need to round, but you may need to include one digit after the decimal point. | back 87 2.0 |
front 88 What is the value of the average total costs (ATC) when Q is equal to 5? Enter the number below. Do not include a dollar sign. You will not need to round, but you may need to include one digit after the decimal point. | back 88 102.0 |
front 89 A firm characterized as a price taker | back 89 has no control over the price at which its product sells. |
front 90 Profit maximization occurs when | back 90 a firm expands output until marginal revenue is equal to marginal cost. |
front 91 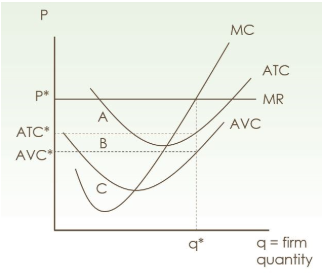 Consider the graph below. Which area(s) represent(s) the firms total fixed costs? | back 91 B |
front 92 Which of the following conditions will result in the firm making a profit? | back 92 P > ATC |
front 93 If all of the firms in an industry are making negative economic profit, what does it mean for those firms? | back 93 The firms' accounting profit < the firms' opportunity cost |
front 94 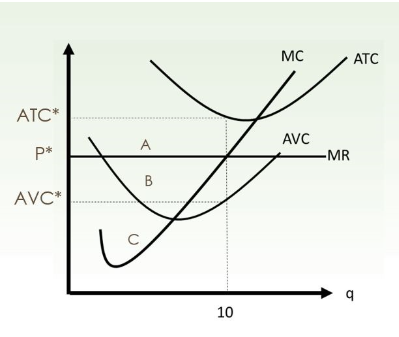 Consider the graph below. Which area(s) represent(s) the firm's profit? | back 94 -A |
front 95 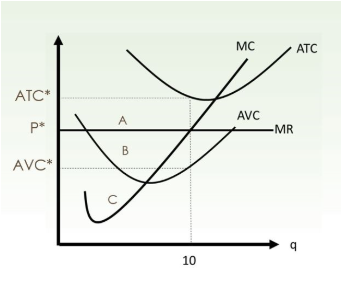 Consider the graph below. Which area(s) represent(s) the firm's total fixed costs? | back 95 A+B |
front 96 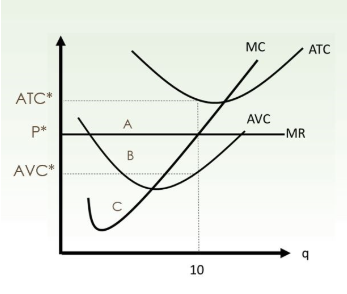 Consider the graph below. Should this firm stay open or shut down in the short run and why? | back 96 Stay open because their loss from operating is less in magnitude than their fixed costs |
front 97 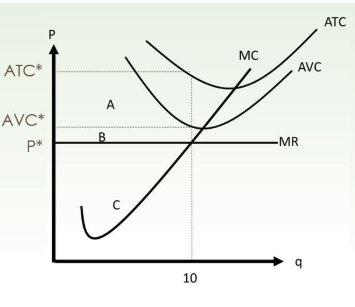 Consider the graph below. Should this firm stay open or shut down in the short run and why? | back 97 Shut down because their loss from operating is greater in magnitude than their fixed costs |
front 98 Consider the graph below. Which area(s) represent(s) the firm's profit? | back 98 -(A+B) |
front 99 Consider the graph below. Which area(s) represent(s) the firms total fixed costs? | back 99 A |
front 100 What is true about economic profit in a long-run competitive equilibrium? | back 100 Economic profit is equal to zero |