Instructions for Side by Side Printing
- Print the notecards
- Fold each page in half along the solid vertical line
- Cut out the notecards by cutting along each horizontal dotted line
- Optional: Glue, tape or staple the ends of each notecard together
Principles of Eco Chapt 10-11 Exam2
front 1 Population Size equation | back 1 Nt+1 = Nt + B - D t+1= pop size at the end of time t = pop size at the beginning of time |
front 2 With a constant 10% annual rate of increase: | back 2 A population of 100 will add 10 individuals per year. constant rate would rapidly climb toward infinity |
front 3 Geometric growth happens during a single time period uses the equation | back 3 N(t+1)=N(t) λ
N(t + 1) = number of individuals at end of period |
front 4 Geometric Growth happens during multiple periods, uses the equation Fig 11.4 (has both expontential and logistic growth) | back 4 Nt = N0 λ t
Nt = # individuals after t units of time GO OVER EXAMPLES ON SLIDES 24 |
front 5 Expotentionel pop growth equation | back 5 Nt = N0 ert
Nt = number of individuals after t time units |
front 6 Rate of increase in pop size equation | back 6 dN/dt = rN
(r) expresses population increase on a “per capita”
or “per individual” basis. |
front 7 Geometric and exponetial growth patterns overlap equation | back 7 λ = er |
front 8 Per capita exponential growth rate equation: | back 8 r=b-d If birth rate is higher than death rate, then r is positive. |
front 9 Growth rates whether the pop size increases, decreases or stays the same | back 9 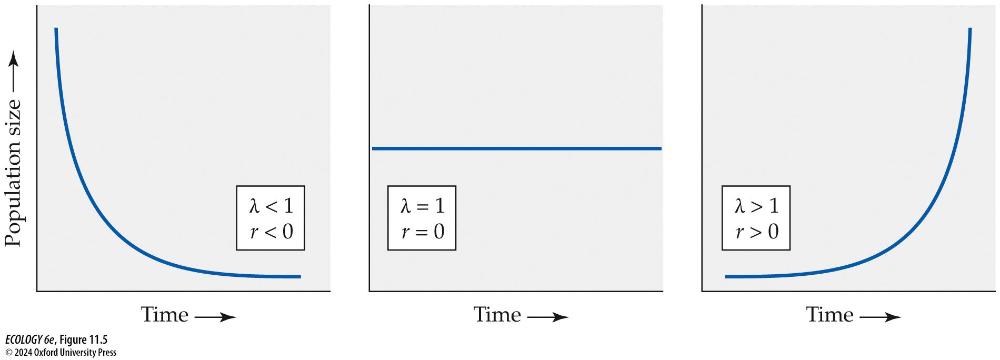 You have a continuously
|
front 10 Density-independent factors affect population size and | back 10 per capita growth rate Ex. abiotic factors such as weather, Fig 11.8 (highest year 1939 for thrips) |
front 11 Density Dependent factors affect pop size and | back 11 growth rate as a consequence of pop density Ex. food availability, habitat availability, predation rates, and parasite infection loads Basically, when pop is large and food is scare, death is on the rise and birth rates decrease (Fig 11.11) |
front 12 Density dependent reproduction and death rates can regulate pop size but | back 12 at high densities, pop growth may decline Fig 11.12 (Pop growth rates declining) |
front 13 The types of limits to exponential and geometric pop growth are | back 13 Populations exhibit geometric and exponential growth when resources
are abundant. However, since resources eventually become limited, this
growth cannot continue indefinitely. |
front 14 Proposal of Pearl and Reed to changing exponential growth equation to logistic growth equation is | back 14 dN/dt = r0N(1 - N/K)
r0 = maximum exponential growth rate |
front 15 This means population size always converges on equilibrium
carrying read slides 48-55 | back 15
populations below K grow |
front 16 Birth rates tend to decline in countries where income
increases. | back 16 children are increasingly perceived as a |
front 17 Population projections vary greatly, the median scenario predicting a plateau at | back 17 10.4 billion in 2050 |
front 18 When each new cohort is larger than the last, the pop is When each new cohort is | back 18 growing declining Fig 11.16 |
front 19 In Fig 11.17, which survorship curive best describes humans? | back 19 Type 1 where most individuals survive to old age Type 2 Straight line down (die at any age) Type 3 Individuals die young |