Instructions for Side by Side Printing
- Print the notecards
- Fold each page in half along the solid vertical line
- Cut out the notecards by cutting along each horizontal dotted line
- Optional: Glue, tape or staple the ends of each notecard together
Results for Spectrophotometric Determination of a Food-Dye SD
front 1 a) What was the molarity of the Alura Red stock solution? b) What are the molarities of each of the diluted solutions you used to prepare your graph? Start with the most dilute solution. Separate each with a comma. c) Show the calculation for one of the solutions in the previous question. Be sure to use correct units and significant figures, and include short verbal descriptions of quantities. | back 1 a) Molarity of the Alura Red stock solution: 4.75 x 10^-5 M b) Molarities of each of the diluted solution used to prepare graph: 1.90 x 10^-7 M, 9.50 x 10^-7 M, 1.90 x 10^-6 M, 2.85 x 10^-6 M. c) Calculation for 1.90 x 10^-7 M => 1.00 mL (standard solution) x 4.75 x 10^-5 M (molarity of the alura red stock solution) = C2 (molarity of diluted unknown) x 250.0 mL (final volume of unknown sports drink solution after dilution) => 1.90 x 10^-7 M |
front 2 What is the equation of your line of best fit from your plot of Absorbance vs. Concentration of the standard solutions? If this was determined by hand show the calculation for the slope and y-intercept. If this was done using Excel type the equation. Include the unit on the slope. | back 2 Equation of line of best fit from plot of Absorbance vs. Concentration of the standard solutions: y = 233064x + 0.0035 |
front 3 If your instructor has asked you to upload a picture of your graph, do so here. Follow the instructions in the video in this folder. Otherwise, hand the graph into you instructor and they will grade it later. | back 3 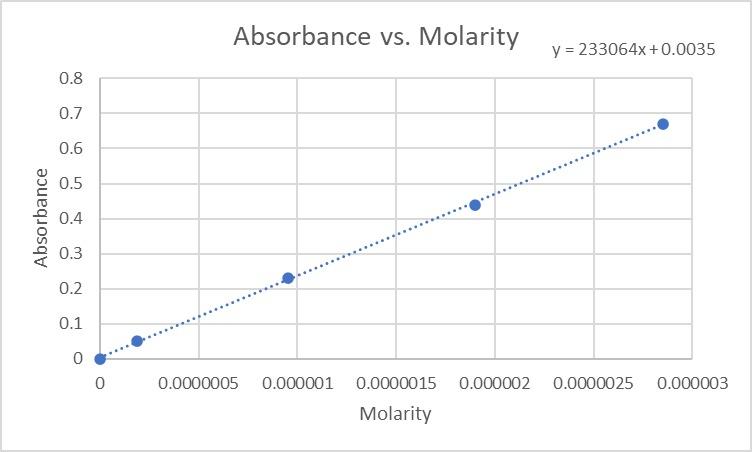 |
front 4 Absorbance of unknown solution after dilution. | back 4 Absorbance of unknown solution after dilution: 0.14 |
front 5 a) What is the molarity of the diluted unknown solution? Be sure to show all work and report your answer with the proper number of significant figures and units. Include short verbal descriptions of quantities. You may assume a value of 0 for the Y-intercept. Use the slope of the graph for this question. b) What is the molarity of the original unknown solution? Be sure to show all work and report your answer with the proper number of significant figures and units. Include short verbal descriptions of quantities. Use the dilution formula (C1V1 = C2V2). | back 5 a) Molarity of the diluted unknown solution => x = (y-b) / m => x = (0.14 (absorbance of unknown solution after dilution) - 0.0035 (y-intercept)) / 233064 (slope) => 5.9 x 10^-7 M b) Molarity of the original unknown solution => (C1V1 = C2V2) => C1 = C2V2 / V1 => C1 = (5.9 x 10^-7 M (molarity of the diluted unknown solution) x 250.0 mL (final volume of unknown sports drink solution after dilution)) / (15.0 mL (volume of unknown sports drink solution used)) => 9.8 x 10^-6 M |
front 6 Your instructor will give you instructions as what to do with this box. It may be used for bonus points, or for taking away points (for example late submissions) or for error analysis if something went wrong during the lab. If no instructions have been provided to you, please leave this box blank. 5% = 5 | back 6 no data |