Instructions for Side by Side Printing
- Print the notecards
- Fold each page in half along the solid vertical line
- Cut out the notecards by cutting along each horizontal dotted line
- Optional: Glue, tape or staple the ends of each notecard together
MBA521 Exam 2 Study Guide
front 1 The Ball Corporation's beverage can manufacturing plant in Fort
Atkinson, Wisconsin, uses a metal supplier that provides metal with a
known thickness standard deviation σ = .000619 mm. Assume a
random sample of 46 sheets of metal resulted in an x¯ = .1903
mm. | back 1 .1903±2.576(.000619/√46)=.1903±.0002351 or (.1901,.1905) |
front 2 Last year, 10 percent of all teenagers purchased a new iPhone. This year, a sample of 260 randomly chosen teenagers showed that 39 had purchased a new iPhone. The test statistic to find out whether the percentage has risen would be | back 2
p = 39/260 = .15, |
front 3 A study showed that 14 of 180 publicly traded business services companies failed a test for compliance with Sarbanes-Oxley requirements for financial records and fraud protection. Assuming that these are a random sample of all publicly traded companies, construct a 95% confidence interval for the overall noncompliance proportion. (Round your answers to 4 decimal places.) | back 3 p=14/180=.0778. p±z√(p(1−p)/n) |
front 4 A random sample of 25 items is drawn from a population whose standard
deviation is known to be σ = 40. The sample mean is x−x− =
270. (b) Construct an interval estimate for μ with 95 percent confidence assuming that n = 50. (Round your answers to 2 decimal places.) (c) Construct an interval estimate for μ with 95 percent confidence assuming that n = 100. (Round your answers to 2 decimal places.) (d) Describe how the confidence interval changes as n increases. | back 4 a) 270±1.96(40/√25) b) 270±1.96(40/√50) c) 270±1.96(40/√100) d) Width decreases as n increases |
front 5 A manufacturer claims that its compact fluorescent bulbs contain an
average of 1.2 mg of mercury. | back 5 H 0: μ = 1.2 mg vs. H 1: μ ≠ 1.2 mg |
front 6 A survey of 4,581 U.S. households that owned a mobile phone found that 58 percent are satisfied with the coverage of their cellular phone provider. Assuming that this was a random sample, construct a 90% confidence interval for the true proportion of satisfied U.S. mobile phone owners. (Round your answers to 3 decimal places.) | back 6 p±z√(p(1-p)/n) .58±1.645√(.58(.42)/4581) = .58±.0120 = (.568, .592) |
front 7 The process that produces Sonora Bars (a type of candy) is intended to produce bars with a mean weight of 56 gm. The process standard deviation is known to be 0.77 gm. A random sample of 49 candy bars yields a mean weight of 55.82 gm. Find the p-value for a test to see whether the candy bars are smaller than they are supposed to be. a) Between .05 and .10 | back 7 a) Between .05 and .10 z calc = (55.82 − 56)/[(0.77)/491/2] = −1.63636 and z .05 = −1.645, or find the exact p-value as =NORM.S.DIST(-1.63636,1) = .0509. |
front 8 Construct a confidence interval for μ assuming that each sample is from a normal population. (a) x¯x¯ = 30, σ = 5, n = 13, 90 percentage confidence. (Round your answers to 2 decimal places.) (b) x¯x¯ = 124, σ = 10, n = 27, 99 percentage confidence. (Round your answers to 2 decimal places.) (c) x¯x¯ = 12.1, σ = 1.1, n = 50, 95 percentage confidence. (Round your answers to 3 decimal places.) | back 8 a) 30 ± 1.645(5/√13) = 30 ± 2.28 b) 124 ± 2.576(10/√27) = 124 ± 4.96 c) 12.1 ± 1.96(1.1/√50) = 12.1 ± .305 |
front 9 In a recent survey, 10 percent of the participants rated Pepsi as
being "concerned with my health." PepsiCo's response
included a new "Smart Spot" symbol on its products that meet
certain nutrition criteria, to help consumers who seek more healthful
eating options. At α = .05, would a follow-up survey showing that 28 of 200 persons now rate Pepsi as being “concerned with my health” provide sufficient evidence that the percentage has increased? | back 9 a) H 0: π ≤ .10 vs. H 1: π > .10. z= (.1400-.10)/√(.10(.90)/200) z = 1.886 b) Yes p-value = 1 – NORM.S.DIST(1.886,1) = 1 – .9704 = .0296 and .0296 < .05, so reject H 0 and conclude that the proportion who believe Pepsi is concerned with consumers’ health has increased. |
front 10 The average age of a part-time seasonal employee at a Vail Resorts
ski mountain has historically been 37 years. a) H 0: μ ≥ 37 yrs vs. H 1: μ < 37 yrs b) H 0: μ ≤ 37 yrs vs. H 1: μ > 37 yrs c) H 0: μ = 37 yrs vs. H 1: μ ≠ 37 yrs | back 10 a) H0: μ ≥ 37 yrs vs. H1: μ < 37 yrs |
front 11 In a two-tailed test, a statistician got a z test statistic of 1.82. What is the p-value? a) .0708 | back 11 b) .0688 From Appendix C we get 2 × P(Z > 1.82) = 2 × .0344 = .0688. The Excel version of this calculation is =2*(1-NORM.S.DIST(1.82,1)) = 0.0688. |
front 12 In the nation of Gondor, the EPA requires that half the new cars sold will meet a certain particulate emission standard a year later. A sample of 64 one-year-old cars revealed that only 24 met the particulate emission standard. The test statistic to see whether the proportion is below the requirement is a) -1.645 | back 12 b) -2.000 p = 24/64 = .375, π 0 = .50, z calc = (.375 − .50)/[(.50)(1 − .50)/64]1/2 = −2.000. |
front 13 (a) A poll of 2,237 likely voters was conducted on the president’s performance. Approximately what margin of error would the approval rating estimate have if the confidence level is 95%? (Round your answer to 4 decimal places.) (b) The poll showed that 46 percent approved the president’s performance. Construct a 90 percent confidence interval for the true proportion. (Round your answers to 4 decimal places.) (c) Would you agree that the percentage of all voters opposed is likely to be 50 percent? | back 13 a) .0210 Margin of error = 1.960 √(.50(1-.5)/2237) = .0207 b) (.4425, .4775) p±z√(p(1−p)/n) =0.46±1.645√(0.46(1 −0.46)/2,237) =0.46±0.0173 or (0.4427, 0.4773) c) No, the confidence interval does not contain .50. |
front 14 Last year, 10 percent of all teenagers purchased a new iPhone. This year, a sample of 260 randomly chosen teenagers showed that 39 had purchased a new iPhone. To test whether the percentage has risen, the p-value is approximately a) .0501 | back 14 d) .0036 p = 39/260 = .15, π 0 = .10, z calc = (.15 − .10)/[(.10)(1 − .10)/260]1/2 = 2.68742. From Appendix C we get P(Z > 2.69) = .0036, or from Excel =1-NORM.S.DIST(2.68742,1) = .0036. |
front 15 The process that produces Sonora Bars (a type of candy) is intended to produce bars with a mean weight of 56 gm. The process standard deviation is known to be 0.77 gm. A random sample of 49 candy bars yields a mean weight of 55.82 gm. Find the test statistic to see whether the candy bars are smaller than they are supposed to be. a) -1.677 | back 15 c) -1.636 z calc = (55.82 − 56)/[(0.77)/491/2] = −1.63636. |
front 16 In a sample of 679 new websites registered on the Internet, 42 were
anonymous (i.e., they shielded their name and contact
information). (b) May normality of p be assumed? | back 16 a) (.0437, .0800) p = 42/679 = .06186 p±z√(p(1-p)/n) .06186 ± 1.960 √.06186(1-.06186)/679) = .06186 ± .0181 or (.0437, .0800) b) Yes |
front 17 A random sample of 150 items is drawn from a population whose standard deviation is known to be σ = 40. The sample mean is x¯ = 790. (a) Construct an interval estimate for μ with 99 percent confidence. (Round your answers to 1 decimal place.) (b) Construct an interval estimate for μ with 99 percent confidence, assuming that σ = 80. (Round your answers to 1 decimal place.) (c) Construct an interval estimate for μ with 99 percent confidence, assuming that σ = 160. (Round your answers to 1 decimal place.) (d) Describe how the confidence interval changes as σ increases. | back 17 a) (781.6, 798.4) 790 ± 2.58 (40/√150) b) (773.2, 806.8) 790 ± 2.58 (80/√150) c) (756.3, 823.7) 790 ± 2.58 (160/√150) d) The confidence interval gets wider as σ increases. |
front 18 A firm decides to test its employees for illegal drugs. (b) Define Type I and II errors. (c) In this case, which type of error has the more severe consequences? | back 18 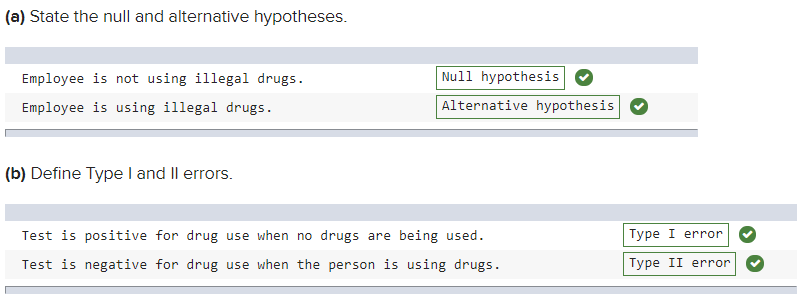 a&b in image attachment c) Type II error |
front 19 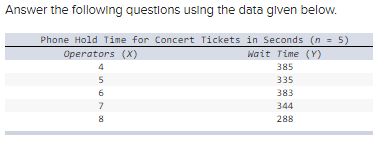 A) Choose the correct set of hypotheses for a two-tailed test for a zero slope. a) H 0: β 1 ≥ 0 vs. H 1: β 1 < 0 b) H 0: β 1 ≤ 0 vs. H 1: β 1 > 0 c) H 0: β 1 = 0 vs. H 1: β 1 ≠ 0 B-1) What is the p-value? (Round your answer to 4 decimal places.) B-2) State the 95% confidence interval for the slope. C) Choose the correct statement. -The slope is not significantly different from zero. -The slope is significantly different from zero. | back 19 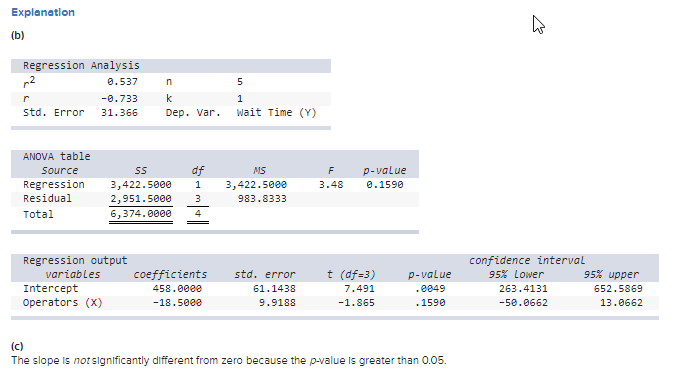 A) c) H 0: β 1 = 0 vs. H 1: β 1 ≠ 0 B-1) .1590 B-2) The confidence interval is from -50.0662 to 13.0662 C) The slope is not significantly different from zero. |
front 20 The fitted regression is Sales = 902-32.8(Price) A-1) If Price = 1, what is the prediction for Sales? (Round your answer to 1 decimal place.) A-2) Choose the correct statement.
B) If Price = 22, what is the prediction for Sales? (Round your answer to the nearest whole number.) C) Choose the right option
| back 20 A-1) Sales = 902-1(32.8) = 869.2 A-2) An increase in price decreases sales. B) Sales = 902 - 22(32.8) = 180 C) The intercept is not meaningful as a zero price is both unrealistic and unobserved. |
front 21 Use Excel to calculate the sample correlation coefficient for each data set. (Round your answers to 4 decimal places.) | back 21 Put each data set into excel and use CORREL(X Data, Y Data) |
front 22 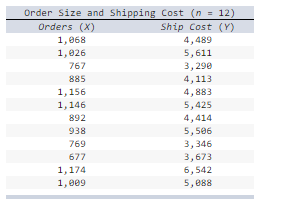 A) Choose the right option
B) Choose the correct statement.
C) Calculate R 2. (Round your answer to 4 decimal places.) D) Interpret the R 2. (Round your answer to 4 decimal places.) | back 22 A) An increase in orders leads to an average increase in shipping cost. B) The intercept is not meaningful in this case. C) .6717 D) 67.17% |
front 23 The regression equation NetIncome = 2,185 + .0392 Revenue was estimated from a sample of 100 leading world companies (variables are in millions of dollars). (a-1) Calculate the residual for the x, y pair ($44,681, $3,720). (A negative value should be indicated by a minus sign. Round your answer to 4 decimal places.)
(b-1) Calculate the residual for the x, y pair ($63,662, $4,513). (A negative value should be indicated by a minus sign. Round your answer to 4 decimal places.) (b-2) Did the regression equation underestimate or overestimate the net income?
| back 23 a-1)y^= $2,185 + .0392($44,681) = $3,936.4952 a-2) The regression equation overestimated the net income. b-1) y^ = $2,185 + .0392($63,662) = $4,680.5504 b-2) The regression equation overestimated the net income. |
front 24 Choose the dependent variable (the response variable to be
"explained") and the independent variable (the
predictor or explanatory variable).
Independent Variable
Obtain the regression equation. (Round your answers to 3 decimal places.) Calculate R 2 | back 24 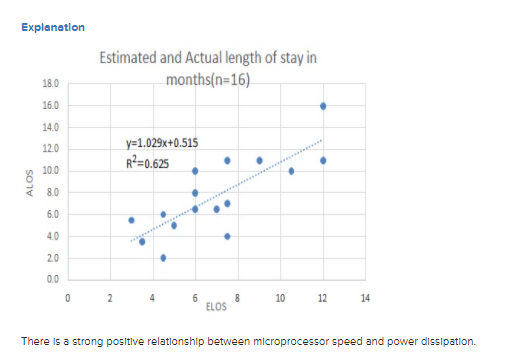 Dependent Variable = ALOS Independent Variable = ELOS Regression Equation = Y = 1.029X + .515 R 2 = .625 |
front 25 Researchers found a correlation coefficient of r = .50 on
personality measures for identical twins. A reporter interpreted this
to mean that "the environment orchestrated one-half of their
personality differences."
(b) r is a measure of the amount of variation.
(c) r = 0.5 implies the environment orchestrated one-half of their personality differences.
| back 25 a) Yes b) No c) False Explanation No, r measures the strength and direction of the linear relationship, but not the amount of variation explained by the explanatory variable. |
front 26 Which is not revealed on a scatter plot?
| back 26 Missing Data values due to nonresponses. Explanation Excel simply omits missing data for a scatter plot. |
front 27 Simple regression was employed to establish the effects of childhood
exposure to lead. The effective sample size was about 122 subjects.
The independent variable was the level of dentin lead (parts per
million). Below are regressions using various dependent
variables.
(b) It would be inappropriate to assume cause and
effect without a better understanding of how the study was conducted.
| back 27 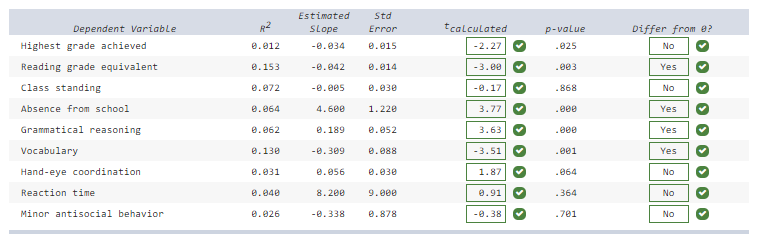
(a) answers in image
t=
estimated slope
(b) Yes |