School administrators collect data on students attending the school. Which of the following variables is quantitative?
a) class( freshman, soph., jr, sr.)
b) whether the student has taken the SAT
c) whether the student is in honors courses
d) Grade Point Average
e) none of these
d) Grade Point Average
Reason: Because it measure the individual, so GPA is the numeric value of the individual.
the colors of book covers on a bookshelf
A) qualitative B) quantitative
A) qualitative
the number of calls received at a companyʹs help desk
A)
quantitative B) qualitative
A) quantitative
the number of seats in a school auditorium
A) quantitative B) qualitative
A) quantitative
the numbers on the shirts of a boyʹs football team
A)
qualitative B) quantitative
A) qualitative
the bank account numbers of the students in a class
A)
qualitative B) quantitative
A) qualitative
The average age of 120 employees of a large company was found to be
37.4 years. Classify the value of 37.4 years of age.
a) The value
37.4 years of age is a parameter.
b) The value 37.4 years of age
is a both a statistic and a parameter.
c) The value of 34.7 years
of age is a statistic.
d) The value of 37.4 years of age is
neither a statistic nor a parameter.
e) none of these
c) The value of 34.7 years of age is a statistic.
A college had 14 dorms each with 4 floors. A researcher numbered the
floors from 1 through 46 and randomly selected 5 floors. He
administered his research instrument to each resident of the five
selected dorm-floors. Identify the sampling technique.
a) simple
random sample
b) cluster sample
c) stratified sample
d) systematic sample
b) cluster sample
Thirty-five math majors, 33 music majors and 45 history majors are
randomly selected from 251 math majors,
518 music majors and 332
history majors at the state university. What sampling technique is
used?
A) stratified
B) simple random
C) cluster
D)
convenience
E) systematic
A) stratified
Every fifth adult entering an airport is checked for extra security
screening. What sampling technique is used?
A) systematic
B)
simple random
C) cluster
D) convenience
E) stratified
A) systematic
A lobbyist for the oil industry assigns a number to each senator and
then uses a computer to randomly
generate ten numbers. The
lobbyist contacts the senators corresponding to these numbers. What
sampling
technique was used?
A) simple random
B)
convenience
C) cluster
D) stratified
E) systematic
A) simple random
A statistics student interviews everyone in his apartment building to
determine who owns a cell phone. What
sampling technique is
used?
A) convenience
B) simple random
C)
cluster
D) systematic
E) stratified
A) convenience
The average age of 120 employees of a large company was found to be
37.4 years. Classify the group of 120 employees.
a) The group of
120 employees is a population in this study.
b) The group of 120
employees is a sample in this study.
c) The group of 120
employees is a parameter in the study.
d) The group of 120
employees is a statistics in this study.
e) none of these.
b) The group of 120 employees is a sample in this study.
A marketing firm did a survey to determine how many people use a
product. Of the one hundred people contacted, 15 said they used the
product. What type of study is this?
a) Observational
b) Experimental
c) Neither
a) Observational
A medical researcher obtains a sample of adults suffering from
diabetes. She randomly assigns 30 people to a
treatment group and
30 to a placebo group. The treatment group receives a medication over
a period of three
months and the placebo group receives a placebo
over the same time frame. At the end of three months
the
patientsʹ symptoms are evaluated.
A) experiment B)
observational study c) Neither
A) experiment
A poll is conducted in which professional musicians are asked their
ages.
A) observational study B) experiment c) Neither
A) observational study
A scientist was studying the effects of a new fertilizer on crop
yield. She randomly assigned half of the plots on
a farm to group
one and the remaining plots to group two. On the plots in group one,
the new fertilizer was
used for a year. On the plots in group
two, the old fertilizer was used. At the end of the year the average
crop
yield for the plots in group one was compared with the
average crop yield for the plots in group two.
A) experiment B)
observational study c) Neither
A) experiment
A statistics student wishes to test the strength of various brands of paper towel. He chooses 5 brands and selects 6 towels from each brand. He numbers them 1-30. He randomly selects a towel and places it in an embroidery hoop. Exactly 10 ml of water and a large weight are placed in the center of the towel. The time it takes for the towel to break is recorded. In this case the explanatory variable is the
a) amount of time it takes for the towel to break.
b) 10 ml of
water and the large weight.
c) brand of paper towel
d) large
weight.
e) number of paper towels used in this experiment.
c) brand of paper towel
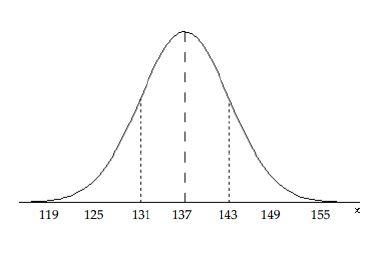
The graph of a normal curve is given. Use the graph to identify the
value of μ and σ.
a) μ = 137, σ = 6
b) μ = 18, σ= 137
c) μ = 137, σ = 18
d) μ = 6, σ = 137
a) μ = 137, σ = 6
The graph of a distribution of data shows that the graph is skewed to
the right then the
a) Mean < Median
b) Mean = Median
c) Mean > Median
d) No conclusion can be made without inspecting the data first.
c) Mean > Median
Last year, nine employees of an electronics company retired. Their
ages at retirement are listed below. Find the mean retirement
age.
Age
/53/67/68/50/62/58/63/52/57
a) 58 years
b) 58.9 years
c) 57.6 years
d) 58.2 years
e) 62
b) 58.9 years
How do calculate the mean using the T-84 calculator?
By pressing 2ND then STAT, Select MATH OPTION , then write as the following.
({4.5,4.5,4.6}) then press ENTER
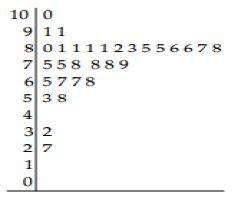
The stem-and-leaf plot shows the results of a mathematics test for 30
students. What is the median score?
a) 81.5
b) 79
c) 87.5
d) 80.5
e) 86.5
C ) 87.5
At one college, GPA’s are normally distributed with a mean of 2.9 and a standard deviation of 0.6. What percentage of students at the college have a GPA between 2.3 and 3.5?
a) 68%
b) 99.7%
c) 95%
d) 84.13%
e) none of the
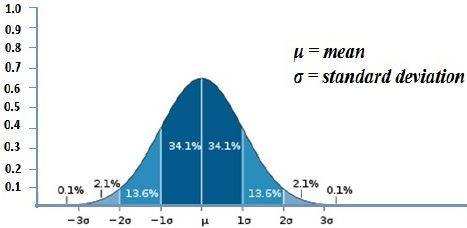
a) 68%
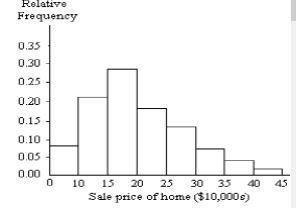
A relative frequency histogram for the sale prices of homes sold in
one city during 2006 is shown below.
Describe the shape of the
distribution
a) symmetric
b) right skewed
c) left skewed
d) uniform
b) right skewed
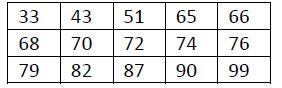
The test scores for 15 students are listed below. Identify any potential outliers.
a) 33
b) 33,43
c) 33, 99
d) there are no outliers
a) 33
You have collected some data. After calculating your measures of
central tendency, you have found the
μ = 80.2 and the median is
also 80.2 Which of the following would BEST describe the shape of the histogram.
a) positively skewed
b) negatively skewed
c) symmetric
c) symmetric
The term test scores of 15 students enrolled in a Introductory
Statistics class were recorded in ascending order as follow:
4,
7, 7, 9, 10, 11, 13, 15, 15, 15, 17, 18, 19, 19, 19, 20
What
number represents the 30th percentile for this data?
a) 7 b) 10
c) 15 d) 18 e) none of these
b) 10
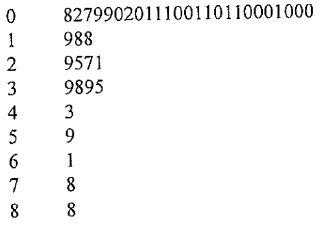
The stem-and-leaf plot to the right summarizes the number of gold
medals earned by 40 countries in the Winter Olympics for
1924-1998.
The data depicts a distribution that is
a) skewed to the left
b) skewed to the right
c) symmetric
d) uniform e) not identifiable from the information given.
b) skewed to the right
In a recent poll adults were asked to estimate the percentage of
children who live in poverty in the United States. The mean response
was 7% and the median was 12%. What does this suggest about the shape
of the distribution of responses.
a) This distribution is most
likely symmetric
b) The standard deviation of the distribution is
.04
c) The distribution is most likely skewed to the
left.
d) The distribution is most likely skewed to the
right.
e) This is a uniformed distribution.
c) The distribution is most likely skewed to the left.
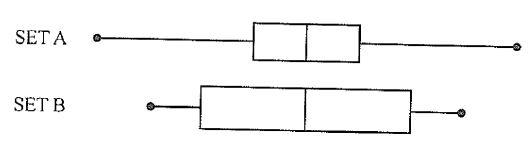
The boxplots to the right summarize two sets of data, A and B. Which
of the following must be true?
I. Set B contains more
observations than Set A.
II. Set A has a larger range than Set
B.
III. Set A and Set B have the same median
a) I only
b) III only
c) I and II only
d) II and III only
e) I, II, and III
d) II and III only
A study was designed to investigate the effects of two variables—(1)
a student’s level of mathematical anxiety and (2) teaching method—on a
student’s achievement in a math course. Students who had a low level
of math anxiety were taught using the traditional expository method.
These students obtained a mean of 270 with a standard deviation of 30
on a standardized test. Assuming a bell-shaped distribution, where
would approximately 95% of the students score?
a) between 180 and 360
b) between 210 and 330
c) below 180 or above 360
d) below 210 or above 330
d) below 210 or above 330
Which of the following is not a principle of design?
a) control
b) comparison
c) replication
d) randomization
e) All of these are principles of design.
b) comparison
Twenty men and 20 women with migraine headaches were subjects in an
experiment to determine the effectiveness of a new pain medication.
Ten of the 20 men and 10 of the 20 women were chosen at random to
receive the new drug. The remaining 10 men and 10 women received a
placebo. The decrease in pain was measure for each subject. The design
of this experiment is
a) completely randomized with one factor,
gender
b) completely, randomized with one factor, drug
c)
randomized block, blocked by drug and gender
d) randomized block,
blocked by gender
e) randomized block, blocked by drug
) randomized block, blocked by gender
In a certain southwestern city the air pollution index averages 62.5 during the year with a standard deviation of 18. Assuming that the empirical rule is appropriate, the index falls within what interval 95% of the time?
A) (8.5, 116.5)
B) (45.4, 79.6)
C) (26.5, 98.5)
D) (44.5, 80.5)
E) Not enough info.
C) (26.5, 98.5)
When a set of data has suspect outliers, which of the following are
preferred measures of central tendency and of variability?
a)
mean and standard deviation
b) mean and variance
c) mean and range
d) median and range
e) median and interquartile range
e) median and interquartile range
The test scores on the Chapter 7 mathematics test have a mean of 66 and a standard deviation of 13. Andrea scored 89 on the test. How many standard deviations from the mean is her score?
a) 0.60 sd below the mean
b) 1.77 sd below the mean
c) 1.77 sd above the mean
d) 0.60 sd above the mean
c) 1.77 sd above the mean
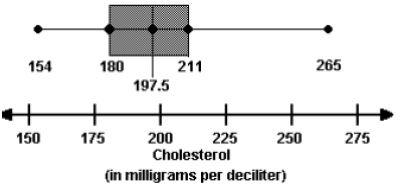
_________ 31) Use the box-and-whisker plot below to determine which
is accurate
a) About 25% of the adults have cholesterol levels of
at most 211
b) about 75% of the adults have cholesterol levels
less than 180.
c) One half of the cholesterol levels are between
180 and 197.5
d) One half of the cholesterol levels are between
180 and 211
e) The mean cholesterol level is 197.5
d) One half of the cholesterol levels are between 180 and 211
In statistics out of 100, marks of 21 students in final exams are as 90, 95, 95, 94, 90, 85, 84, 83, 85, 81, 92, 93, 82, 78, 79, 81, 80, 82, 85, 76, 85 then mode of data is
A) 85
B) 95
C) 90
D) 81
A) 85