Determine whether the given description corresponds to an observational study or an experiment.
A clinic gives a drug to a group of ten patients and a placebo to another group of ten patients to find out if the drug has an effect on the patients' illness.
Experiment
Determine whether the given description corresponds to an observational study or an experiment.
A T.V. show's executives raised the fee for commercials following a report that the show received a "No. 1" rating in a survey of viewers.
Observational study
Determine whether the given description corresponds to an observational study or an experiment.
A quality control specialist compares the output from a machine with a new lubricant to the output of machines with the old lubricant.
Experiment
Determine whether the given description corresponds to an observational study or an experiment.
A T.V. show's executives commissioned a study to gauge the impact of the show's ratings on the sales of its advertisers.
Observational study
You are dealt two cards successively (without replacement) from a shuffled deck of 52 playing cards. Find the probability that the first card is a King and the second card is a queen. Express your answer as a simplified fraction.
4/663
(4/52) x (4/51)
A bag contains 2 red marbles, 3 blue marbles, and 7 green marbles. If a marble is randomly selected from the bag, what is the probability that it is blue?
1/4
(3blue / 12total)
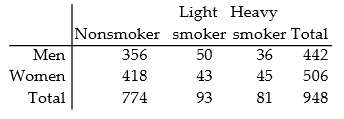
The table above describes the smoking habits of a group of asthma sufferers.
If two different people are randomly selected from the 948 subjects, find the probability that they are both heavy smokers. Round to six decimal places.
0.007218
(81/948) x (80/947)
Find the probability of correctly answering the first 5 questions on a multiple choice test if random guesses are made and each question has 6 possible answers.
1/7776
(1) x (1/6)5

The data set represents the income levels of the members of a country club. Find the probability that a randomly selected member earns at least $97,000. Round your answers to the nearest tenth.
0.7
1 – (6/20)
In one town, 79% of adults have health insurance. What is the probability that 4 adults selected at random from the town all have health insurance? Round to the nearest thousandth if necessary.
0.39
(0.79)4
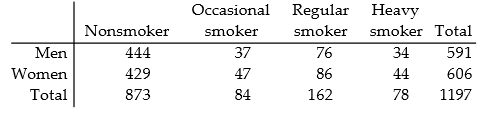
The table above describes the smoking habits of a group of asthma sufferers.
If one of the 1197 people is randomly selected, find the probability of getting a regular or heavy smoker.
0.201
(162/1197) + (78/1197)
Find the probability that 3 randomly selected people all have the same birthday. Ignore leap years. Round to eight decimal places.
0.00000751
(1) x (1/365) x (1/365)
A sample of 100 wood and 100 graphite tennis rackets are taken from the warehouse. If 6 wood and 14 graphite are defective and one racket is randomly selected from the sample, find the probability that the racket is wood or defective.
0.57
(100/200) + (20/200) – (6/200)
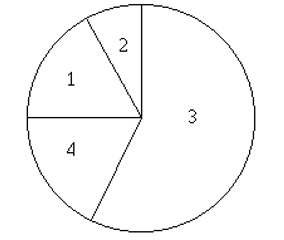
100 employees of a company are asked how they get to work and whether they work full time or part time. The figure above shows the results. If one of the 100 employees is randomly selected, find the probability of getting someone who carpools or someone who works full time.
1. Public transportation: 7 full time, 10 part time
2. Bicycle: 4 full time, 3 part time
3. Drive alone: 30 full time, 31 part time
4. Carpool: 6 full time, 9 part time
0.56
(15/100) + (47/100) – (6/100)
The probability that Luis will pass his statistics test is 0.90. Find the probability that he will fail his statistics test.
0.10
1 – 0.90
Find the z-score corresponding to the given value and use the z-score to determine whether the value is unusual. Consider a score to be unusual if its z-score is less than -2.00 or greater than 2.00. Round the z-score to the nearest tenth if necessary.
A weight of 110 pounds among a population having a mean weight of 164 pounds and a standard deviation of 25.6 pounds.
–2.1; unusual
(110 – 164) ÷ 25.6 = -2.11
Find the z-score corresponding to the given value and use the z-score to determine whether the value is unusual. Consider a score to be unusual if its z-score is less than -2.00 or greater than 2.00. Round the z-score to the nearest tenth if necessary.
A
–1.9; not unusual
(50 – 69) ÷ 10 = -1.9
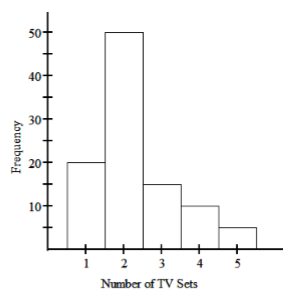
The histogram above represents the number of television sets per household for a sample of U.S. households. What is the maximum number of households having the same number of television sets?
50
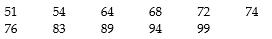
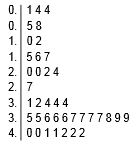
When finding percentiles, if the locator L is not a whole number, one procedure is to interpolate so that a locator of 23.75, for example, leads to a value that is 3/4 of the way between the 23rd and 24th scores. Use this method of interpolation to find P75 for the set of test scores above.
89
A computer company employs 100 software engineers and 100 hardware engineers. The personnel manager randomly selects 20 of the software engineers and 20 of the hardware engineers and questions them about career opportunities within the company. Does this sampling plan result in a random sample? Simple random sample? Explain.
Yes; no. The sample is random because all employees have the same chance of being selected. It is not a simple random sample because some samples are not possible, such as a sample consisting of 30 software engineers and 10 hardware engineers.
A researcher obtains an alphabetical list of the 2560 students at a college. She uses a random number generator to obtain 50 numbers between 1 and 2560. She chooses the 50 students corresponding to those numbers. Does this sampling plan result in a random sample? Simple random sample? Explain.
Yes; yes. The sample is random because all students have the same chance of being selected. It is a simple random sample because all samples of 50 students have the same chance of being selected.
An education expert is researching teaching methods and wishes to interview teachers from a particular school district. She randomly selects ten schools from the district and interviews all of the teachers at the selected schools. Does this sampling plan result in a random sample? Simple random sample? Explain.
Yes; no. The sample is random because all teachers have the same chance of being selected. It is not a simple random sample because some samples are not possible, such as a sample that includes teachers from schools that were not selected.
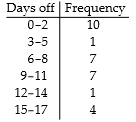
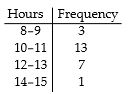
The frequency table above shows the number of days off in a given year for 30 police detectives.
Construct a histogram. Use the class midpoints for the horizontal scale. Does the result appear to be a normal distribution? Why or why not?
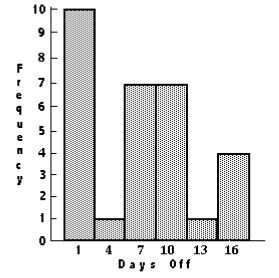
The distribution does not appear to be normal. It is not bell-shaped and it is not symmetric.
Construct a frequency distribution and the corresponding histogram in which the following conditions are satisfied:
– The frequency for the second class is twice the frequency of the first class.
– In the histogram, the area of the bar corresponding to the second class is four times the area of the bar corresponding to the first class.
The class width of the second class should be twice the class width of the first class.
Sturges' guideline suggests that when constructing a frequency distribution, the ideal number of classes can be approximated by 1 + (log n)/(log 2), where n is the number of data values. Use this guideline to find the ideal number of classes when the number of data values is 33.
6
1 + (log 33)/(log 2)
= 6.044394119
Human body temperatures have a mean of 98.20°F and a standard deviation of 0.62°. Sally's temperature can be described by z =1.4. What is her temperature? Round your answer to the nearest hundredth.
99.07°F
x = z × σ + µ
x = 1.4 × 0.62 + 98.2
x = 99.068
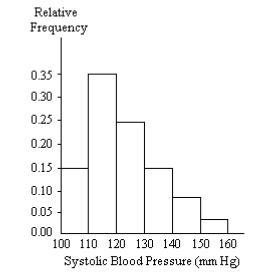
A nurse measured the blood pressure of each person who visited her clinic. Following is a relative-frequency histogram for the systolic blood pressure readings for those people aged between 25 and 40. The blood pressure readings were given to the nearest whole number. What class width was used to construct the relative frequency distribution?
10
(110 – 100)
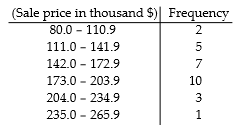
The frequency distribution above summarizes the home sale prices in the city of Summerhill for the month of June. Determine the width of each class.
31
(111.0 – 80.0)
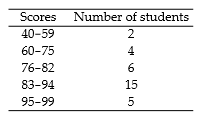
The following frequency distribution analyzes the scores on a math test. Find the class midpoint of scores interval 95-99.
97.0
(99 – 95) ÷ 2 = 2
95 + 2 = 97
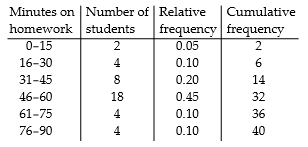
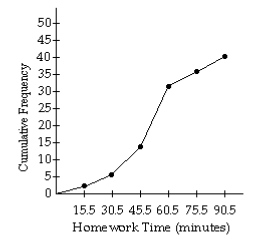
The table contains data from a study of daily study time for 40 students from Statistics 101. Construct an ogive from the data.
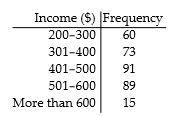
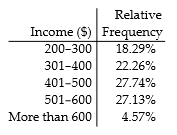
The frequency distribution for the weekly incomes of students with part-time jobs is given above. Construct the corresponding relative frequency distribution. Round relative frequencies to the nearest hundredth of a percent if necessary.
Use the given data to construct a frequency distribution.
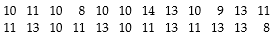
Lori asked 24 students how many hours they had spent doing homework during the previous week. The results are shown above.
Construct a frequency distribution. Use 4 classes, a class width of 2 hours, and a lower limit of 8.
Identify the type of observational study (cross-sectional, retrospective, prospective).
A town obtains current employment data by polling 10,000 of its citizens this month.
Cross-sectional
Identify the type of observational study (cross-sectional, retrospective, prospective).
Researchers collect data by interviewing athletes who have won olympic gold medals from 1992 to 2008.
Retrospective
Is Event B dependent or independent of Event A?
A: A green ball is drawn from a box with five balls and placed next to the box.
B: A red ball is drawn next and placed next to the green one.
Dependent
Identify which of these types of sampling is used: random, stratified, systematic, cluster, convenience.
To avoid working late, a quality control analyst simply inspects the first 100 items produced in a day.
Convenience
Identify which of these types of sampling is used: random, stratified, systematic, cluster, convenience.
The name of each contestant is written on a separate card, the cards are placed in a bag, and three names are picked from the bag.
Random
Identify which of these types of sampling is used: random, stratified, systematic, cluster, convenience.
49, 34, and 48 students are selected from the Sophomore, Junior, and Senior classes with 496, 348, and 481 students respectively.
Stratified
Identify which of these types of sampling is used: random, stratified, systematic, cluster, convenience.
A market researcher selects 500 people from each of 10 cities.
Stratified
Find the range for the given sample data.
The manager of an electrical supply store measured the diameters of the rolls of wire in the inventory. The diameters of the rolls (in meters) are listed below.
0.177 0.115 0.542 0.413 0.618 0.315
0.503 m
(0.618 – 0.115)
Find the range for the given sample data.
The prices (in dollars) of 12 electric smoothtop ranges are listed below.
835 950 625 535 1435 1050
650 735 760 1250 525 1035
$910
(1435 – 525)
From the information provided, create the sample space of possible outcomes.
Both Fred and Ed have a bag of candy containing a lemon drop, a cherry drop, and a lollipop. Each takes out apiece and eats it. What are the possible pairs of candies eaten?
LD-LD CD-LD LP-LP LD-CD CD-CD LD-LP LP-CD CD-LP LP-LD
Express the indicated degree of likelihood as a probability value.
"It will definitely turn dark tonight."
1
Use the data to create a stemplot.
The normal monthly precipitation (in inches) for August is listed for 39 different U.S. cities. Construct an expanded stemplot with about 9 rows.
3.5 1.6 2.4 3.7 4.1 3.9 1.0 3.6 1.7 0.4 3.2 4.2 4.1 4.2 3.4 3.7 2.2 1.5 4.2 3.4 2.7 4.0 2.0 0.8 3.6 3.7 0.4 3.7 2.0 3.6 3.8 1.2 4.0 3.1 0.5 3.9 0.1 3.5 3.4
Use the data to create a stemplot.
The attendance counts for this season's basketball games are listed below.
227 239 215 219
221 233 229 233
235 228 245 231

Solve the problem. Round results to the nearest hundredth.
The mean height of a basketball team is 6 feet with a standard deviation of 0.2 feet. The team's center is 6.7 feet tall. Find the center's z score. Is his score unusual?
3.5, yes
z = (x – µ) ÷ σ
= (6.7 – 6) ÷ 0.2
= 3.5
3.5 > 2.00 (unusual)
Determine whether the given value is from a discrete or continuous data set.
The total number of phone calls a sales representative makes in a month is 425.
Discrete
Determine whether the given value is from a discrete or continuous data set.
The number of limbs on a 2-year-old oak tree is 21.
Discrete
Determine which of the four levels of measurement (nominal, ordinal, interval, ratio) is most appropriate.
Nationalities of survey respondents.
Nominal
Determine which of the four levels of measurement (nominal, ordinal, interval, ratio) is most appropriate.
Student's grades, A, B, or C, on a test.
Ordinal
Determine which of the four levels of measurement (nominal, ordinal, interval, ratio) is most appropriate.
Salaries of college professors.
Ratio
Find the variance for the given data. Round your answer to one more decimal place than the original data.
–12 6 –3 6 12
88.2
s = 9.391485505
variance = s2 = 88.19999999
Find the percentile for the data value.
Data set: 122 134 126 120 128 130 120 118 125 122 126 136 118 122 124 119;
data value: 128
75
Find the midrange for the given sample data.
3 6 9 0 4 1 11 5 9 14 3 8 2 15 0 9
7.5
(15 – 0) ÷ 2 = 7.5
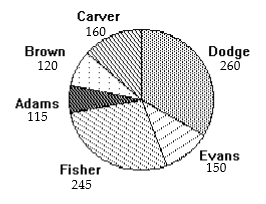
The pie chart above gives the number of students in the residence halls at the state university.
Write the ratio of the number of residents at Adams to the number of students at Evans.
23:30
Adams: 115
Evans: 150
115:150
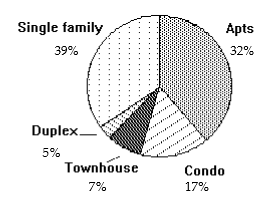
The pie chart shows the percent of the total population of 73,700 of Springfield living in the given types of housing. Round your result to the nearest whole number.
Find the number of people who live in duplexes.
3685 people
Duplex: 5%
73,700 × 5% = 3,685
A student earned grades of A, C, A, A, and B. Those courses had these corresponding numbers of credit hours: 1, 6, 3, 1, 3. The grading system assigns quality points to letter grades as follows: A = 4, B = 3, C = 2, D = 1, and F = 0.
Compute the grade point average (GPA) and round the result to two decimal places.
2.93
L1: 4, 2, 4, 4, 3
L2: 1, 6, 3, 1, 3
1-Var Stats: x̄ = 2.928571429
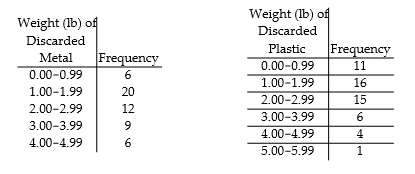
Construct one table that includes relative frequencies based on the two frequency distributions below. Do those weights appear to be about the same or are they substantially different.? Round to the nearest tenth of a percent if necessary.
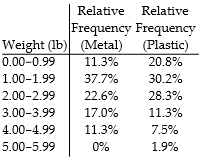
The weights are different, but they do not appear to be substantially different.
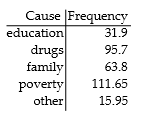
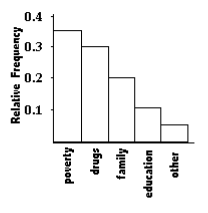
At the National Criminologists Association's annual convention, participants filled out a questionnaire asking what they thought was the most important cause for criminal behavior. The tally is shown above.
Construct a Pareto chart to display these findings.
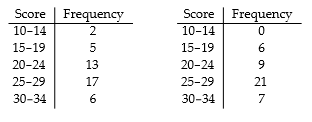
The data shows the roundtrip mileage that 43 randomly selected professors and students drive to school each day. Compare the results by constructing two frequency polygons on the same axes, and determine whether there appears to be any significant difference between the two groups.
There does not appear to be a significant difference.
The coefficient of variation, expressed as a percent, is used to describe the standard deviation relative to the mean. It allows us to compare variability of data sets with different measurement units and is calculated as follows:
coefficient of variation = 100 (s/x̄)
Find the coefficient of variation for the following sample of weights (in pounds):
130 127 186 105 197
153 172 150 116 125
21.1%
Find the mode(s) for the given sample data.
–20 –43 –46 –43 –49 –43 –49
–43
Find the coefficient of variation for each of the two sets of data, then compare the variation. Round results to one decimal place.
Compare the variation in heights to the variation in weights of thirteen-year old girls. The heights (in inches) and weights (in pounds) of nine randomly selected thirteen-year old girls are listed below.
Heights (inches): 59.1 61.3 62.1 64.7 60.1 58.3 64.6 63.7 66.1
Weights (pounds): 87 94 91 119 96 90 123 98 139
Heights: 4.4%
Weights: 17.5%
There is substantially more variation in the weights than in the heights of the girls.
If you drew one card from a standard deck, would it be "unusual" to draw an eight of clubs?
Yes
1/52 = 0.019 < 0.05
Assume that a study of 300 randomly selected school bus routes showed that 278 arrived on time. Is it "unusual" for a school bus to arrive late?
No
278/300 = 0.927 < 0.95 (complement of 0.05)
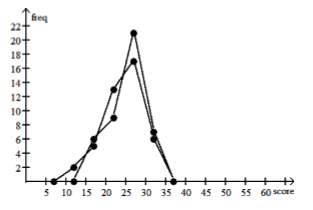
Find the original data from the stemplot.
61, 67, 71, 71, 73, 75, 81, 83, 83, 87, 89, 93, 95
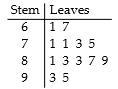
Construct a pie chart representing the given data set.
The following figures give the distribution of land (in acres) for a county containing 70,000 acres.
Forest Farm Urban
10,500 7000 52,50
Find the standard deviation for the given sample data. Round your answer to one more decimal place than is present in the original data.
20.0 21.5 27.4 47.3 13.1 11.1
13.11
Use the range rule of thumb to estimate the standard deviation. Round results to the nearest tenth.
The maximum value of a distribution is 23.6 and the minimum value is 7.4.
4.1
A polling firm, hired to estimate the likelihood of the passage of an up-coming referendum, obtained the set of survey responses to make its estimate. The encoding system for the data is: 1 = FOR,2 = AGAINST. If the referendum were held today, estimate the probability that it would pass.
1, 2, 2, 1, 1, 2, 1, 2, 2, 1, 1, 1, 2, 1, 2, 1, 1, 1, 2, 1
0.6
The local Tupperware dealers earned these commissions last month:
$1077.28 $2661.13 $4642.11 $4264.15 $1019.55 $3444.20 $2525.92 $3740.26 $3533.07 $1633.84
What was the mean commission earned? Round your answer to the nearest cent.
$2854.15
Identify the sample and population. Also, determine whether the sample is likely to be representative of the population.
100,000 randomly selected adults were asked whether they drink at least 48 oz of water each day and only 45% said yes.
Sample: the 100,000 selected adults;
population: all adults;
representative
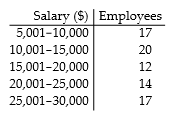
Find the mean of the data summarized in the given frequency distribution.
A company had 80 employees whose salaries are summarized in the frequency distribution below. Find the mean salary.
$17,125.00
What is the probability of an impossible event?
0
Determine whether the events are disjoint.
Draw one ball colored red from a bag.
Draw one ball colored blue from the same bag.
Yes
Determine whether the events are disjoint.
Go to a formal dinner affair.
Wear blue jeans.
Yes
Determine whether the given value is a statistic or a parameter.
After taking the first exam, 15 of the students dropped the class.
Parameter
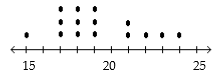
Construct the dotplot for the given data.
The following data represent the number of cars passing through a toll booth during a certain time period over a number of days.
18 19 17 17 24 18 21 18 19 15 22 19 23 17 21
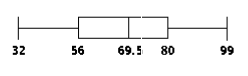
Construct a boxplot for the given data. Include values of the 5-number summary in all boxplots.
The test scores of 32 students are listed below. Construct a boxplot for the data set.
32 37 41 44 46 48 53 55 57 57 59 63 65 66 68 69 70 71 74 74 75 77 78 79 81 82 83 86 89 92 95 99