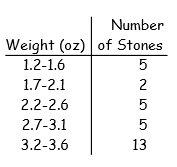
Construct the cumulative frequency distribution that corresponds to the given frequency distribution.
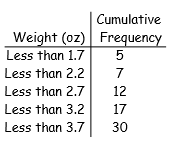
5 (+5)
7 (5 + 2)
12 (5 + 2 + 5)
17 (5 + 2 + 5+ 5)
30 (5 + 2 + 5 + 5 + 13)
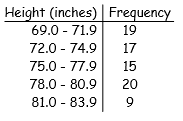
Construct the cumulative frequency distribution that corresponds to the given frequency distribution.
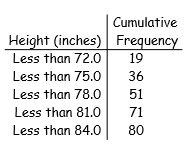
19 (+19)
36 (19 + 17)
51 (19 + 17 + 15)
71 (19 + 17 + 15 + 20)
80 (19 + 17 + 15 + 20 + 9)
Provide an appropriate response.
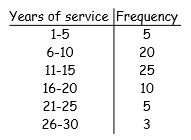
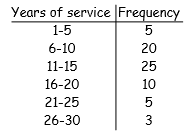
The frequency distribution below summarizes employee years of service for Alpha Corporation.
Find the class boundaries for class 26-30.
25.5, 30.5
Provide an appropriate response.
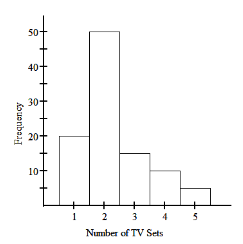
The histogram below represents the number of television sets per household for a sample of U.S.households.
How many households are included in the histogram?
100
sum total of frequencies
= (20 + 50 + 15 + 10 + 5)
Provide an appropriate response.
The frequency distribution below summarizes employee years of service for Alpha Corporation.
Find the class midpoint for class 1-5.
3.0
midpoint = (1 + 5) ÷ 2 = 3.0
Provide an appropriate response.
Sturges' guideline suggests that when constructing a frequency distribution, the ideal number of classes can be approximated by 1 + (log n)/(log 2), where n is the number of data values.
Use this guideline to find the ideal number of classes when the number of data values is 146.
8
1 + ( log(146) ) ÷ ( log(2) )
= 8.2
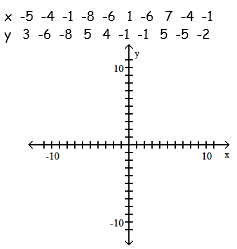
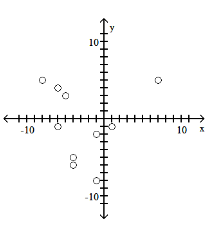
Use the given paired data to construct a scatterplot.
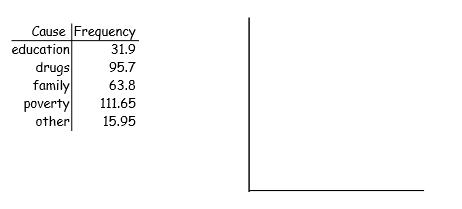
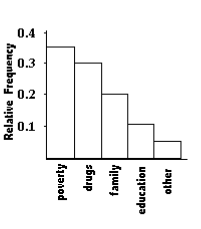
Solve the problem.
At the National Criminologists Association's annual convention, participants filled out a questionnaire asking what they thought was the most important cause for criminal behavior. The tally was as follows.
Construct a Pareto chart to display these findings.
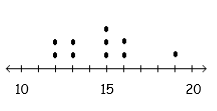
Construct the dotplot for the given data.
A store manager counts the number of customers who make a purchase in his store each day. The data are as follows.
15 16 13 19 12 15 15 16 13 12
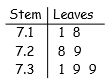
Find the original data from the stemplot.
7.11, 7.18, 7.28, 7.29, 7.31, 7.39, 7.39