
Listed below are the top 10 annual salaries (in millions of dollars) of TV personalities.
Find the (a) mean, (b) median, (c) mode, and (d) midrange for the given sample data in millions of dollars.
(e) Given that these are the top 10 salaries, do we know anything about the salaries of TV personalities in general?
(f) Are such top 10 lists valuable for gaining insight into the larger population?
a. The mean is 20.60.
b. The median is 14.25.
c. There is no mode.
d. The midrange is 23.85.
e. Since the sample values are the 10 highest, they give almost no information about the salaries of TV personalities in general.
f. No, because such top 10 lists represent an extreme subset of the population rather than the larger population
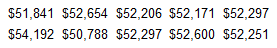
Listed below are the annual tuition amounts of the 10 most expensive colleges in a country for a recent year.
Find the mean, midrange, median, and mode of the data set.
What does this "Top 10" list tell us about the population of all of that country's college tuitions?
The mean of the data set is $52329.7.
The midrange of the data set is $52490.0.
The median of the data set is $52274.0.
The mode(s) of the data set is (are) $52297.
Nothing meaningful can be concluded from this information except that these are the largest tuitions of colleges in the country for a recent year.

Listed below are the playing times (in seconds) of songs that were popular at the time of this writing.
Find the (a) mean, (b) median, (c) mode, and (d) midrange for the given sample data.
(e) Is there one time that is very different from the others?
a. The mean is 259.8 seconds.
b. The median is 243.0 seconds.
c. The mode is 243 & 216 seconds.
d. The midrange is 333.5 seconds.
e. Yes; the time of 451 seconds is very different from the others.

An insurance institute conducted tests with crashes of new cars traveling at 6 mi/h. The total cost of the damages was found for a simple random sample of the tested cars and listed below.
Find the (a) mean, (b) median, (c) mode, and (d) midrange for the given sample data.
(e) Do the different measures of center differ very much?
a. The mean is $6362.6.
b. The median is $6332.0.
c. There is no mode.
d. The midrange is $6608.5.
e. The different measures of center do not differ by very large amounts.

Listed below are the lead concentrations (in mg/g) measured in different samples of a medicine.
Find the mean, midrange, median, and mode of the data set.
What do the results suggest about the safety of this medicine?
What do the decimal values of the listed amounts suggest about the precision of the measurements?
The mean of the data set is 10.60 mg/g.
The midrange of the data set is 11.50mg/g.
The median of the data set is 10.75 mg/g.
The mode(s) of the data set is (are) 4.5.
There is not enough information for any meaningful conclusion.
They are rounded to one half unit measurements.

Listed below are the measured radiation emissions (in W/kg) corresponding to cell phones: A, B, C, D, E, F, G, H, I, J, and K respectively. The media often present reports about the dangers of cell phone radiation as a cause of cancer. Cell phone radiation must be 1.6 W/kg or less.
Find the a. mean, b. median, c. midrange, and d. mode for the data.
e. If you are planning to purchase a cell phone, are any of the measures of center the most important statistic? Is there another statistic that is most relevant? If so, which one?
a. The mean is 0.930.
b. The median is 0.870.
c. The midrange is 0.990.
d. There is no mode.
e. The maximum data value is the most relevant statistic, because it is closest to the limit of 1.6W/kg and that cell phone should be avoided.

Listed below are the errors between the predicted temperatures and actual temperatures of a certain city.
Find the mean and median for each of the two samples.
Do the means and medians indicate that the temperatures predicted one day in advance are more accurate than those predicted 5 days in advance, as we might expect?
The mean difference between actual high and the predicted high one day earlier is 0.5°.
The median difference between actual high and the predicted high one day earlier is 1.0°.
The mean difference between actual high and the predicted high five days earlier is -0.3°.
The median difference between actual high and the predicted high five days earlier is 2.0°.
No, the means and medians do not indicate any substantial difference in accuracy.

Statistics are sometimes used to compare or identify authors of different works. The lengths of the first 10 words in a book by Terry are listed with the first 10 words in a book by David.
Find the mean and median for each of the two samples.
Compare the two sets of results. Does there appear to be a difference?
The mean number of letters per word in Terry's book is 3.5.
The median number of letters per word in Terry's book is 3.0.
The mean number of letters per word in David's book is 3.1.
The median number of letters per word in David's book is 3.0.
Yes. Based on the results, words in Terry's book are longer than the words in David's book.

Waiting times (in minutes) of customers in a bank where all customers enter a single waiting line and a bank where customers wait in individual lines at three different teller windows are listed below.
Find the mean and median for each of the two samples.
Determine whether there is a difference between the two data sets that is not apparent from a comparison of the measures of center. If so, what is it?
The mean waiting time for customers in a single line is 7.11 minutes.
The median waiting time for customers in a single line is 7.10 minutes.
The mean waiting time for customers in individual lines is 7.11 minutes.
The median waiting time for customers in individual lines is 7.10 minutes.
The times for customers in individual lines are much more varied than the times for customers in a single line.
Notice that the mean and median waiting times for customers in single and individual lines are the same. To determine if there is a difference between the two data sets that is not apparent from the comparison of the means and medians, compare how the data values vary among themselves in each set.
Use the magnitudes (Richter scale) of the earthquakes listed in the data set below.
Find the mean and median of this data set.
Is the magnitude of an earthquake measuring 7.0 on the Richter scale an outlier (data value that is very far away from the others) when considered in the context of the sample data given in this data set? Explain.
The mean of the data set is 1.452.
The median of the data set is 1.470.
Yes, because this value is very far away from all of the other data values.

Find the mean of the data summarized in the given frequency distribution.
Compare the computed mean to the actual mean of 52.3°.
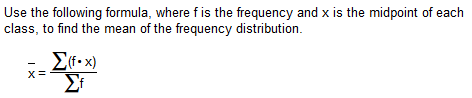
The mean of the frequency distribution is 52.5°.
[(1 x 42) + (6 x 47) + (13 x 52) + (7 x 57) + (2 x 62)] ÷ 29 = 52.52
The computed mean is close to the actual mean because the difference between the means is less than 5%.

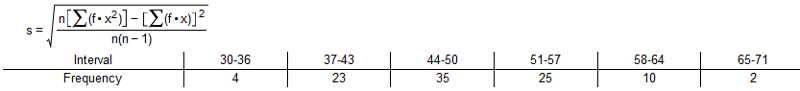
Find the mean of the data summarized in the given frequency distribution.
Compare the computed mean to the actual mean of 46.6 miles per hour.
The mean of the frequency distribution is 46.5 miles per hour.
[(28 x 43.5) + (16 x 47.5) + (6 x 51.5) + (3 x 55.5) + (1 x 59.5)] ÷ 54 = 46.54
The computed mean is close to the actual mean because the difference between the means is less than 5%.
The geometric mean is often used in business and economics for finding average rates of change, average rates of growth, or average ratios. Given n values (all of which are positive), the geometric mean is the nth root of their product.
The average growth factor for money compounded at annual interest rates of 14%, 6%, and 3% can be found by computing the geometric mean of 1.14, 1.06, and 1.03. Find that average growth factor.
The single percentage growth rate is found by subtracting 1 from the growth factor and then multiplying by 100%. What single percentage growth rate would be the same as having three successive growth rates of 14%, 6%, and 3%?
Is that result the same as the mean of 14%, 6%, and 3%?
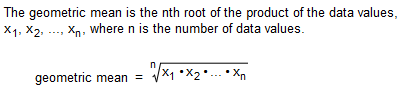
The average growth factor is 1.0757.
(1.14 x 1.06 x 1.03)^(1/3) = 1.075678893
The single percentage growth rate that would be the same as having three successive growth rates of 14%, 6%, and 3% is 7.57%.
(1.0757 – 1) x 100 = 7.57
The mean of 14%, 6%, and 3% is 7.67%.
The single percentage growth rate is not the same as the mean of 14%, 6%, and 3%.
Methods used that summarize or describe characteristics of data are called _______ statistics.
descriptive
Descriptive statistics are methods and tools that summarize or describe relevant characteristics of data.
Which of the following is NOT a measure of center?
census
A census is the collection of data from every member of the population. It is not a measure of center.

Listed below are the top 10 annual salaries (in millions of dollars) of TV personalities.
Find the range, variance, and standard deviation for the sample data.
Given that these are the top 10 salaries, is the standard deviation of the sample a good estimate of the variation of salaries of TV personalities in general?
The range of the sample data is $33.5 million.
The variance of the sample data is 191.10.
The standard deviation of the sample data is $13.82 million.
No, because the sample is not representative of the whole population.
Six different second-year medical students at Bellevue Hospital measured the blood pressure of the same person. The systolic readings (in mmHg) are listed below.
Find the range, variance, and standard deviation for the given sample data.
If the subject's blood pressure remains constant and the medical students correctly apply the same measurement technique, what should be the value of the standard deviation?
Range = 18 mmHg
Sample variance = 43.1 mmHg²
Sample standard deviation = 6.6 mmHg
Ideally, the standard deviation would be zero because all the measurements should be the same.

Listed below are the amounts of mercury (in parts per million, or ppm) found in tuna sushi sampled at different stores.
Find the range, variance, and standard deviation for the set of data.
What would be the values of the measures of variation if the tuna sushi contained no mercury?
The range of the sample data is 0.97 ppm.
Sample variance = 0.140 ppm²
Sample standard deviation = 0.374 ppm
The measures of variation would all be 0.

Listed below are the arrival delay times (in minutes) of randomly selected airplane flights from one airport to another. Negative values correspond to flights that arrived early before the scheduled arrival time, and positive values represent lengths of delays.
Find the range, variance, and standard deviation for the set of data.
Some of the sample values are negative, but can the standard deviation ever be negative?
The range of the sample data is 41 minutes.
The variance of the sample data is 200.5 minutes².
The standard deviation of the sample data is 14.2 minutes.
No, because the squared value in the standard deviation formula cannot be negative.

Listed below are amounts (in millions of dollars) collected from parking meters by a security service company and other companies during similar time periods.
Find the coefficient of variation for each of the two samples, then compare the variation.
Do the limited data listed here show evidence of stealing by the security service company's employees? Consider a difference of greater than 1% to be significant.
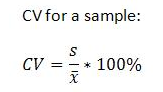
The coefficient of variation for the amount collected by the security service company is 9.98%.
(0.1567021236 ÷ 1.57) x 100 = 9.981026981
The coefficient of variation for the amount collected by the other companies is 7.65%.
(0.1316561177 ÷ 1.72) x 100 = 7.654425448
Yes. There is a significant difference in the variation.
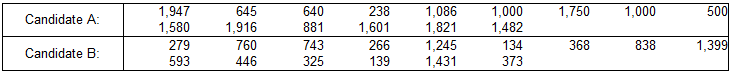
Listed below are contributions (in dollars) made to two presidential candidates in a recent election.
Find the coefficient of variance for each data set.
Is there a difference in variation between the two data sets? Consider a difference of greater than 1% to be significant.
The coefficient of variation for the contributions to Candidate A is 46.36%.
The coefficient of variation for the contributions to Candidate B is 70.39%.
The contributions to Candidate A have significantly less variation than the contributions to Candidate B.
Refer to the data set of times required to taxi out for takeoff, listed below in minutes.
Use technology to find the range, variance, and standard deviation.
The range of the data set is 40 minutes.
The variance, s², of the data set is 151.4 minutes².
The standard deviation, s, of the data set is 12.3 minutes.
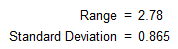
Below are the range and standard deviation for a set of data.
Use the range rule of thumb and compare it to the standard deviation listed below.
Does the range rule of thumb produce an acceptable approximation? Suppose a researcher deems the approximation as acceptable if it has an error less than 15%.
The estimated standard deviation is 0.695.
2.78 ÷ 4 = 0.695
No, because the error of the range rule of thumb's approximation is greater than 15%.
A certain group of test subjects had pulse rates with a mean of 77.6 beats per minute and a standard deviation of 10.2 beats per minute.
Would it be "unusual" for one of the test subjects to have a pulse rate of 68.0 beats per minute?
Minimum "usual" value = 57.2 beats per minute
minimum "usual" value = (mean)
– 2 x (standard deviation)
77.6 – 2(10.2) = 57.2
Maximum "usual" value = 98.0 beats per minute
minimum "usual" value = (mean) + 2 x (standard deviation)
77.6 – 2(10.2) = 98.0
No, because it is between the minimum and maxmum "usual" values.
Cans of regular soda have volumes with a mean of 13.51 oz and a standard deviation of 0.12 oz.
Is it "unusual" for a can to contain 13.59 oz of soda?
Minimum "usual" value = 13.27 oz
Maximum "usual" value = 13.75 oz
No, because it is between the minimum and maxmum "usual" values.
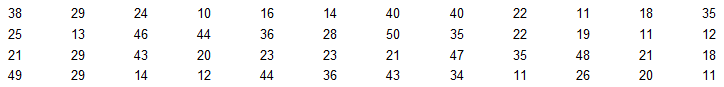
Find the standard deviation, s, of sample data summarized in the frequency distribution table given below by using the formula below, where x represents the class midpoint, f represents the class frequency, and n represents the total number of sample values.
Compare the computed standard deviation to the standard deviation obtained from the original list of data values, 9.0. Consider a difference of 20% between two values of a standard deviation to be significant.
Standard deviation = 7.7
---------------------------------------------------------------------------------
(Use calculator)
L1 L2
midpt freq
1–Var Stats L1,L2
Sx = 7.679830596
---------------------------------------------------------------------------------
The computed value is not significantly different from the given value.
Heights of men on a baseball team have a bell-shaped distribution with a mean of 178 cm and a standard deviation of 8 cm.
Using the empirical rule, what is the approximate percentage of the men between the following values?
a. 154 cm and 202 cm
b. 170 cm and 186 cm
a. 99.73% of the men are between 154 cm and 202 cm.
(154 – 178) ÷ 8 = -3
(202 – 178) ÷ 8 = 3
3 SD... 99.73%
b. 68% of the men are between 170 cm and 186 cm.
(170 – 178) ÷ 8 = -1
(186 – 178) ÷ 8 = 1
1 SD... 68%
- one standard deviation from the mean accounts for about 68% of the set
- two standard deviations from the mean account for about 95%
- three standard deviations from the mean account for about 99.7%.
Which of the following is NOT a property of the standard deviation?
A. The value of the standard deviation is never negative.
B. When comparing variation in samples with very different means, it is good practice to compare the two sample standard deviations.
C. The standard deviation is a measure of variation of all data values from the mean.
D. The units of the standard deviation are the same as the units of the original data.
B. When comparing variation in samples with very different means, it is good practice to compare the two sample standard deviations.
It's a good practice to compare two sample standard deviations
only when the sample means are approximately the same.
When comparing variation in samples with very different
means, it is better to use the coefficient of variation, which is
defined later in this section.
The Range Rule of Thumb roughly estimates the standard deviation of a data set as _______.
s = range ÷ 4
The square of the standard deviation is called the _______.
variance
The term variance has a specific statistical meaning and is equal to the square of the standard deviation.
If your score on your next statistics test is converted to a z score, which of these z scores would you prefer: –2.00, –1.00, 0, 1.00, 2.00? Why?
The z score of 2.00 is most preferable because it is 2.00 standard deviations above the mean and would correspond to the highest of the five different possible test scores.
A z score (or standardized value) is the number of standard deviations that a given value x is above or below the mean. A negative z score corresponds to an x value less than the mean. A positive z score corresponds to an x value greater than the mean. The more negative the z score, the further the x value is below the mean. The more positive the z score, the further the x value is above the mean.
With a height of 68 in, George was the shortest president of a particular club in the past century. The club presidents of the past century have a mean height of 73.7 in and a standard deviation of 2.7 in.
a. What is the positive difference between George's height and the mean?
b. How many standard deviations is that [the difference found in part (a)]?
c. Convert George's height to a z score.
d. If we consider "usual" heights to be those that convert to z scores between –2 and 2, is George's height usual or unusual?
a. The positive difference between George's height and the mean is 5.7 in.
( height – mean )
b. The difference is 2.11 standard deviations.
(positive difference ÷ standard deviation)
c. The z score is –2.11.
(difference ÷ standard deviation)
d. Unusual
A particular group of men have heights with a mean of 173 cm and a standard deviation of 7 cm. Carl had a height of 180 cm.
a. What is the positive difference between Carl's height and the mean?
b. How many standard deviations is that [the difference found in part (a)]?
c. Convert Carl's height to a z score.
d. If we consider "usual" heights to be those that convert to z scores between –2 and 2, is Carl's height usual or unusual?
a. The positive difference between Carl's height and the mean is 7 cm.
( height – mean )
b. The difference is 1 standard deviations.
(positive difference ÷ standard deviation)
c. The z score is 1.
(difference ÷ standard deviation)
d. Usual
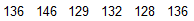
IQ scores are measured with a test designed so that the mean is 100 and the standard deviation is 18. Consider the group of IQ scores that are unusual.
What are the z scores that separate the unusual IQ scores from those that are usual?
What are the IQ scores that separate the unusual IQ scores from those that are usual? (Consider a value to be unusual if its z score is less than –2 or greater than 2.)
The lower z score boundary is –2.
The higher z score boundary is 2.
The lower bound IQ score is 64.
(lower z score x standard deviation) + mean
The higher bound IQ score is 136.
(higher z score x standard deviation) + mean
In a recent year the magnitudes (Richter scale) of 10,594 earthquakes were recorded. The mean is 1.218 and the standard deviation is 0.584. Consider the magnitudes that are unusual.
What are the magnitudes that separate the unusual magnitudes from those that are usual? (Consider a value to be unusual if its z score is less than –2 or greater than 2.)
The lower bound earthquake magnitude is 0.05.
(lower z score x standard deviation) + mean
The higher bound earthquake magnitude is 2.386.
(higher z score x standard deviation) + mean
One of the tallest living men has a height of 261 cm. One of the tallest living women is 243 cm tall. Heights of men have a mean of 170 cm and a standard deviation of 8 cm. Heights of women have a mean of 159 cm and a standard deviation of 3 cm.
Relative to the population of the same gender, who is taller? Explain.
The woman is relatively taller because the z score for her height is greater than the z score for the man's height.
Man z score = (261 – 170) ÷ 8 = 11.375
Woman z score = (243 – 159) ÷ 3 = 28
Which is relatively better: a score of 52 on a psychology test or a score of 46 on an economics test? Scores on the psychology test have a mean of 94 and a standard deviation of 15. Scores on the economics test have a mean of 55 and a standard deviation of 5.
The economics test score is relatively better because its z score is greater than the z score for the psychology test score.
Psych = (52 – 94) ÷ 15 = –2.8
Econ = (46 – 55) ÷ 5 = –1.8
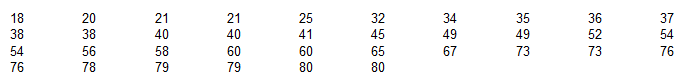
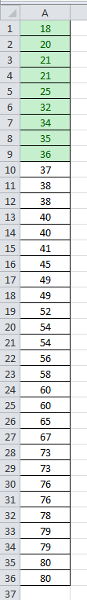
Below are 36 sorted ages of an acting award winner.
Find the percentile corresponding to age 32 using the method presented in the textbook.
percentile of value 32 = 25
percentile of value x = number of values less than x
÷ total number of values x 100
9 ÷ 36 x 100 = 25.0
Below are 36 sorted ages of an acting award winner.
Find the percentile corresponding to age 60 using the method presented in the textbook.
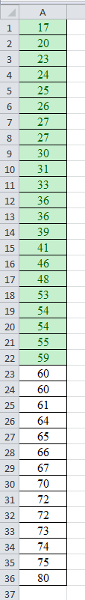
percentile of value 60 = 61
percentile of value x = number of values less than x
÷ total number of values x 100
22 ÷ 36 x 100 = 61.1
Below are 36 sorted ages of an acting award winner.
Find P80 using the method presented in the textbook.
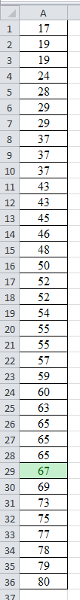
P80 = 67
L = (k ÷ 100) x n
= (80 ÷ 100) x 36 = 28.8 = 29
The value of P80 is the 29th value, counting from the
lowest. The 29th value is 67.

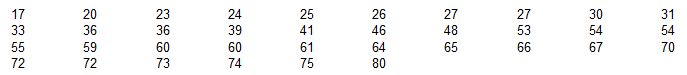
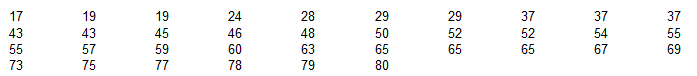
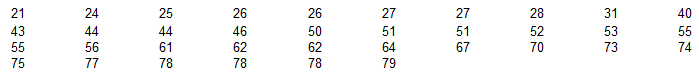
Find the third quartile Q3 of the list of 24 sorted values shown below.
The third quartile Q3 is 60.
Quartiles are measures of location, denoted Q1, Q2, and Q3, which divide a set of data into four groups with about 25% of the values in each group. Note that quartiles and percentiles are related (Q1 = P25, Q2 = P50, and Q3 = P75 ).
L = k ÷ 100 x n
75 ÷ 100 x 24 = 18
Since L = 18 is a whole number, to find P75, add the 18th value and the next value in the sorted set of data and divide the total by 2.
The 18th value is 59. The 19th value is 61.
59 + 61 = 120
120 ÷ 2 = 60
Since P75 = 60, the third quartile Q3 is 60.
Below are 36 sorted ages of an acting award winner.
Find P75 using the method presented in the textbook.
P75 = 68.5
L = k ÷ 100 x n
75 ÷ 100 x 36 = 27
What is the Lth = 27th value in the sorted list? 67
What is the next value in the sorted list? 70
P75 = (67 + 70) ÷ 2 = 68.5
Below are 36 sorted ages of an acting award winner.
Find P50 using the method presented in the textbook.
P50 = 47.5
L = k ÷ 100 x n
50 ÷ 100 x 36 = 18
What is the Lth = 18th value in the sorted list? 47
What is the next value in the sorted list? 48
P50 = (47 + 48) ÷ 2 = 47.5

The following are the duration times (minutes) of all missions flown by a space shuttle.
Use the given data to construct a boxplot and identify the 5-number summary.
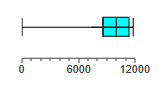
The 5-number summary is 6, 8603, 10014, 11407, 11809.
For a set of data, the 5-number summary consists of the five values listed below.
1. Minimum
2. First quartile, Q1
3. Second quartile, Q2 (same as the median)
4. Third quartile, Q3
5. Maximum
(Use Calculator)

The following are the interval times (minutes) between eruptions of a geyser.
Detemine the five number summary and construct a box plot from the data below.
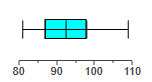
The 5-number summary is 81, 87, 92.5, 98, 109.

The following are amounts of time (minutes) spent on hygiene and grooming in the morning by survey respondents.
Determine the 5-number summary and construct a boxplot for the data given below.
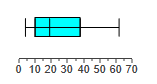
The 5-number summary is 4, 10, 19, 38, 62.

The following are speeds (mi/h) of cars measured with a radar gun.
Determine the 5-number summary and boxplot for the data given below.
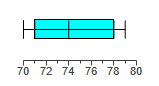
The 5-number summary is 70, 71, 74, 78, 79
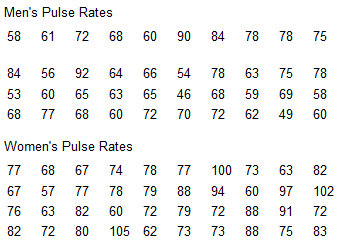
Use the same scales to construct boxplots for the pulse rates of males and females from the accompanying data sets.
Use the boxplots to compare the two data sets.
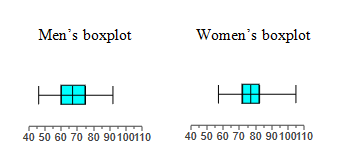
Men's: 46, 60, 67, 75,92
Women's: 57, 72, 77, 82.5, 105
In general, it appears that males have lower pulse rates than females. The variation among the male pulse rates is similar to the variation among the female pulse rates.
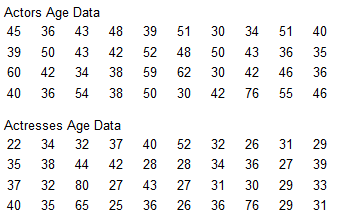
Use the same scale to construct boxplots for the ages of the best actors and best actresses from the accompanying data sets.
Use the boxplots to compare the two data sets.
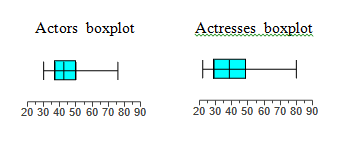
Actor's: 30, 37, 42.5, 50, 76
Actresses: 22, 29, 33.5, 38.5, 80
Although actresses include the oldest age, the boxplot representing actresses shows that they have ages that are generally lower than those of actors.
When a data value is converted to a standardized scale representing the number of standard deviations the data value lies from the mean, we call the new value a _______.
z-score
The term z-score represents a standardized value and is the number of standard deviations that a given x-value is above or below the mean.
A data value is considered _______ if its z-score is less than –2 or greater than 2.
unusual
A data value is considered unusual when it lies far from the mean. We define data values that are further than 2 standard deviations away from the mean as unusual.
Whenever a data value is less than the mean, _______.
the corresponding z-score is negative
A negative z-score indicates a data value is less than the mean.
In modified boxplots, a data value is a(n) _______ if it is above Q3 + (1.5)(IQR) or below Q1 – (1.5)(IQR).
outlier
For the purposes of constructing modified boxplots, outliers are any data values above Q3 + (1.5)(IQR) or below Q1 – (1.5)(IQR).
Which of the following is NOT a value in the 5-number summary?
- Q1
- Mean
- Median
- Minimum
Mean