What is a voluntary response sample?
A sample in which the subjects themselves decide whether to be included in the study.
Determine whether the source given below has the potential to create a bias in a statistical study.
A certain medical organization tends to oppose the use of meat and dairy products in our diets, and that organization has received hundreds of thousands of dollars in funding from an animal rights foundation.
There does appear to be a potential to create a bias. There is an incentive to produce results that are in line with the organization's creed and that of its funders.
Determine whether the source given below has the potential to create a bias in a statistical study.
Washington University obtained word counts from the most popular novels of the past five years.
There does not appear to be a potential to create a bias. The organization would not gain from putting a spin on the results.
Determine whether the sampling method described below appears to be sound or is flawed.
In a survey of 659 subjects, each was asked how often he or she watched TV. The survey subjects were internet users who responded to a question that was posted on a news website.
It is flawed because it is a voluntary response sample.
Determine whether the sampling method described below appears to be sound or is flawed.
In a survey of 655 human resource professionals, each was asked about the importance of the education of a job applicant. The survey subjects were randomly selected by pollsters from a reputable market research firm.
It appears to be sound because the data are not biased in any way.
Determine whether the results below appear to have statistical significance, and also determine whether the results have practical significance.
In a study of a weight loss program, 5 subjects lost an average of 43 lbs. It is found that there is about a 21% chance of getting such results with a diet that has no effect.
No, the program is not statistically significant because the results are likely to occur by chance.
Yes, the program is practically significant because the amount of lost weight is large enough to be considered practically significant.
In a study of a weight loss program, 40 subjects lost a mean of 3.5 lbs after 12 months. Methods of statistics can be used to show that if this diet had no effect, the likelihood of getting these results is roughly 10 chances in 1000. Does the weight loss program have statistical significance? Does the weight loss program have practical significance?
Yes, the program is statistically significant because the results are unlikely to occur by chance.
No, the program is not practically significant because someone starting a weight loss program would likely want to lose considerably more than 3.5 lb.
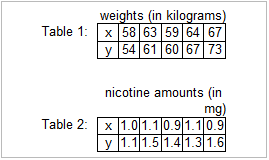
The data in table 1 are the weights (in kilograms) of freshman students. The x-values are weights measured in September and the y-values are their corresponding weights measured in April of the following spring. The x-values in table 2 are nicotine amounts (in mg) in different 100 mm filtered, non-"light" menthol cigarettes. The y-values in table 2 are nicotine amounts (in mg) in different king-size nonfiltered, nonmenthol, and non-"light" cigarettes.
In data table 2, is each x-value matched with a corresponding y-value, as in data table 1? That is, is each x-value associated with the corresponding y-value in some meaningful way?
In table 2, does it make sense to use the difference between each x-value and the y-value that is in the same column?
No because, unlike table 1 in which each weight in September is matched with the weight of the same student in April, there is no association between the cigarettes. The order of the x-values does not correspond in any way with the order of the y-values.
No because none of the x-values are associated with any of the y-values. Since they are not associated, the differences between the x- and y-values have no real meaning.
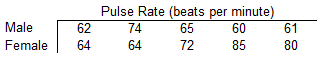
Given the data in the table below, what issue can be addressed by conducting a statistical analysis of the pulse rates?
Statistical analysis involves the ability to see the big picture; to consider such relevant factors as context, source of data, and sampling method; and to form conclusions and identify practical implications. Statistical analysis involves critical thinking and the ability to make sense of results. In this case, the data can be used to address the issue of whether males or females have pulse rates with the same average (mean) values since one could compute the average pulse rate of the five males and five females.
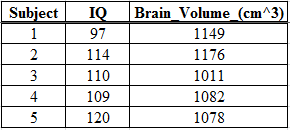
Refer to the given table of measurements below.
Is there some meaningful way in which the IQ scores are matched with the corresponding brain volumes?
If they are matched, does it make sense to use the difference between each IQ score and brain volume that is in the same column? Why or why not?
Yes, each IQ score is matched with the brain volume in the same column, because they are measurements obtained from the same person.
No, it does not make sense to use the difference between each IQ score and brain volume in the same column, because IQ scores and brain volumes use different units of measurement.

In the data table below, the x-values are the weights (in pounds) of cars and the y-values are the corresponding highway fuel consumption amounts (in mi/gal).
Comment on the source of the data if you are told that car manufacturers supplied the values. Is there an incentive for car manufacturers to report values that are not accurate?
Yes, because consumers, in general, would prefer to buy a car with a higher level of fuel efficiency. In this case, the source of the data would be suspect with a potential for bias.
Several studies showed that after eating a very large meal, subjects had increased risk of heart attack. A diet food manufacturer financed this research. What is wrong with this study?
Self-interest study
Based on a study of ages of men and women who have children, a researcher concludes that being a parent causes people to age. Do you agree with this conclusion?
No. There may be a relationship between having children and the age of an adult, but that does not mean that one causes the other.
A polling company reported that 57% of 1018 surveyed adults said that rising gas prices are "quite annoying." Complete parts (a) through (d) below.
a. What is the exact value that is 57% of 1018?
b. Could the result from part (a) be the actual number of adults who said that rising gas prices are "quite annoying" question mark Why or why not?
c. What could be the actual number of adults who said
that rising gas prices are "quite annoying"?
d. Among the 1018 respondents, 128 said that rising gas prices are "not at all annoying." What percentage of respondents said that rising gas prices are "not at all annoying"?
a. The exact value is 580.26.
b. No, the result from part (a) could not be the actual number of adults who said that rising gas prices are "quite annoying" because a count of people must result in a whole number.
c. The actual number of adults with this opinion could be 581.
d. 12.57%
A polling company reported that 59% of 2302 surveyed adults said that they play baseball. Complete parts (a) through (d) below.
a. What is the exact value that is 59% of 2302?
b. Could the result from part (a) be the actual number of adults who said that they play baseball question mark Why or why not?
c. What could be the actual number of adults who said that they play baseball?
d. Among the 2302 respondents, 765 said that they only play hockey. What percentage of respondents said that they only play hockey?
a. The exact value is 1358.18.
b. No, the result from part (a) could not be the actual number of adults who said that they play baseball because a count of people must result in a whole number.
c. The actual number of adults who play baseball could be 1359.
d. 33.23%
A report about the decline of Western investment in third world countries included this: "After years of daily flights, several European airlines halted passenger service. Foreign investment fell 400 percent during the 1990s. What is wrong with this statement?
If foreign investment fell by 100%, it would be totally eliminated, so it not possible for it to fall by more than 100%.
A researcher was once criticized for falsifying data. Among his data were figures obtained from 8 groups of mice, with 5 individual mice in each group. These values were given for the percentage of successes in each group: 53%, 58%, 63%, 46%, 48% , 67% , 54% , 42%. What's wrong with those values?
All percentages of success should be multiples of 20. The given percentages cannot be correct.
A researcher was once criticized for falsifying data. Among his data were figures obtained from 8 groups of mice, with 5 individual mice in each group. These values were given for the percentage of successes in each group: 53%, 58%, 63%, 46%, 48% , 67% . What's wrong with those values?
All percentages of success should be multiples of 25. The given percentages cannot be correct.
Which of the following is typically the least important factor to consider when conducting a statistical analysis of data?
Formula calculation
In learning to think statistically, common sense and practical considerations are typically more important than calculations and formulas.
Which of the following is NOT a voluntary response sample?
Quiz scores from a college level statistics course are analyzed to determine student progress.
Using quiz scores from a college level statistics course that are analyzed to determine student progress would not be a voluntary response sample because respondents themselves do not decide to be included.
What does it mean for the findings of a statistical analysis of data to be statistically significant?
The likelihood of getting these results by chance is very small.
Statistical significance is indicated when methods of statistics are used to reach a conclusion that it is unlikely that the findings occurred by chance.
Which of the following would be considered practically significant?
In a very large study, it was found that Treatment I resulted in 93% success while Treatment II resulted in 75% success.
A very large study in which it was found that Treatment I resulted in 93% success while Treatment II resulted in 75% success is practically significant since Treatment I appears to have a substantially higher success rate.
What is the goal of learning statistics?
To learn to distinguish between statistical conclusions that are likely to be valid and those that are seriously flawed
Statistics is the science of planning studies and experiments, obtaining data, and then organizing, summarizing, presenting, analyzing, interpreting, and drawing conclusions based on the data. Statisticians universally agree that statistical thinking is good, but there are different views of what actually constitutes statistical thinking. Statistical thinking involves critical thinking and the ability to make sense of results. Statistical thinking might involve determining whether results are statistically significant.
Which of the following would NOT cast doubt of the usefulness of sample data?
An effective sampling method
In the use of statistics, effective sampling methods are important. If sample data are not collected in an appropriate way, the data may be useless.
What is a self-interest study?
A survey in which the sponsor can enjoy monetary or other gains from the results
A self-interest study is a survey in which the sponsor can enjoy monetary or other gains from the results. Be very wary of studies where the sponsor has certain interests to promote.