In a certain class of students, there are 11 boys from Wilmette, 6
girls from Winnetka, 7 girls from Wilmette, 4 boys from Glencoe, 2
boys from Winnetka and 9 girls from Glenoce. If the teacher calls upon
a student to answer a question, what is the probability that the
student will be a boy?
A) 0.385
B) 0.436
C) 0.8
D) 0.282
B) 0.436
11+4+2 = 17 boys
6+7+9 = 22 girls
total 39 students
17/39 = .436
The diameters of bolts produced by a certain machine are normally
distributed with a mean of 0.30 inches and a standard deviation of
0.01 inches.What percentage of bolts will have a diameter greater than
0.32 inches?
A) 2.28%
B) 37.45%
C) 97.72%
D) 47.72%
A) 2.28%
(.32-.3)/.01 =
normalcdf
lower 2
A sample of 100 wood and 100 graphite tennis rackets are taken from
the warehouse. If 9 wood and 14 graphite are defective and one racket
is randomly selected from the sample, find the probability that the
racket is wood or defective.
A) 0.545
B) 0.115
C) 0.57
D) There is
insufficient information to answer the question.
C) 0.57
total 100w+100g=200
defective 9w+14g= 23
100/200 + 14/200 = 114/200
In one town, 61% of adults have health insurance.What is the
probability that 6 adults selected at random from the town all have
health insurance
A) 0.098
B) 0.61
C) 3.66
D) 0.052
D) 0.052
.616
Assume that a hypothesis test of the given claim will be conducted.
Identify the type I or type II error for the test.
A cereal company claims that the mean weight of the cereal in
its packets is 14 oz. Identify the type I error for the test.
A) Reject the claim that the mean weight is 14 oz when it is
actually greater than 14 oz.
B) Reject the claim that the mean
weight is 14 oz when it is actually 14 oz.
C) Reject the claim
that the mean weight is different from 14 oz when it is actually 14
oz.
D) Fail to reject the claim that the mean weight is 14 oz
when it is actually different from 14 oz.
B) Reject the claim that the mean weight is 14 oz when it is actually 14 oz.
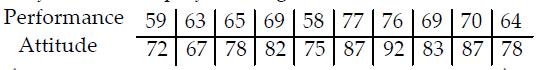
Use the given data to find the equation of the regression line.
A)y^= -47.3 + 2.02x
B)y^= 11.7 + 1.02x
C)y^= 2.81 +
1.35x
D)y^= 92.3 - 0.669x
B)y^= 11.7 + 1.02x
L1 & L2
stat / calc / LinReg (#8)
The probability that z lies between -1.10 and -0.36
A) 0.4951
B) 0.2239
C) -0.2237
D) 0.2237
D) 0.2237
normalcdf
lower -1.10
upper -0.36
.22375?
According to a college survey, 22% of all students work full time.
Find the mean for the number of students who work full time in samples
of size 16.
A) 2.8
B) 4.0
C) 3.5
D) 0.2
C) 3.5
16*.22
A student earned grades of 91, 76, 92, and 79 on her four regular
tests. She earned a grade of 79 on the final exam and 85 on her class
projects. Her combined homework grade was 87. The four regular tests
count for 40% of the final grade, the final exam counts for 30%, the
project counts for 10%, and homework counts for 20%.What is her
weighted mean grade? Round to one decimal place.
A) 84.2
B) 84.1
C) 83.4
D) 82.4
C) 83.4
(((91+76+92+79)/4)*.4) + (79*.3)+ (85*.1)+ (87*.2)
The annual precipitation amounts in a certain mountain range are
normally distributed with a mean of 95 inches, and a standard
deviation of 16 inches.What is the probability that the mean annual
precipitation during 64 randomly picked years will be less than 97.8
inches?
A) 0.0808
B) 0.4192
C) 0.9192
D) 0.5808
C) 0.9192
use new standard dev = 16/sqrt(64) = 2
(97.8 - 95)/2 = 1.4
normalcdf
upper 1.4
The probabilities that a batch of 4 computers will contain 0, 1, 2,
3, and 4 defective computers are 0.4979, 0.3793, 0.1084, 0.0138, and
0.0007, respectively. Find the standard deviation for the probability
distribution.
A) σ = 0.54
B) σ = 0.73
C) σ = 0.68
D) σ = 0.97
B) σ = 0.73
Use Stats L1 & L2
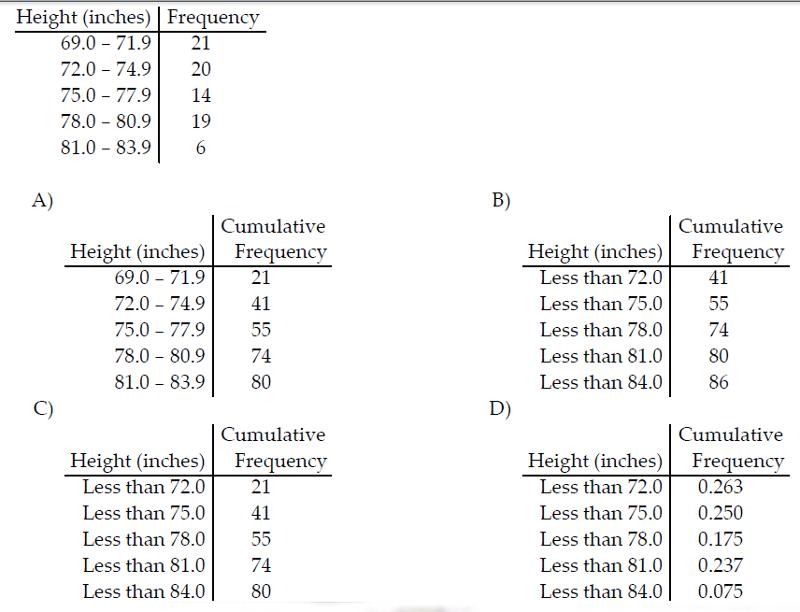
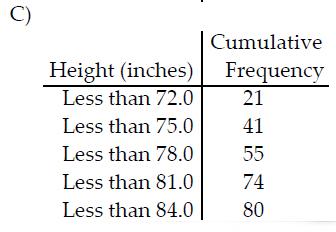
Construct the cumulative frequency distribution that corresponds to the given frequency distribution.
A health and fitness club surveys 40 randomly selected members and
found that the average weight of those questioned is 157 lb.
A) Statistic
B) Parameter
A) Statistic
How many women must be randomly selected to estimate the mean weight
of women in one age
group.We want 90% confidence that the sample
mean is within 2.7 lb of the population mean, and the population
standard deviation is known to be 22 lb.
A) 180
B) 256
C) 178
D) 181
A) 180
Za/2 = (1-.9)/2 = .05 invNorm = 1.645
((Za2*standev)/E)2 = ((1.645*22)/2.7)2
Human body temperatures are normally distributed with a mean of
98.20°F and a standard deviation of 0.62°F. Find the temperature that
separates the top 7% from the bottom 93%. Round to the nearest
hundredth of a degree.
A) 99.12°F
B) 97.28°F
C) 98.78°F
D) 98.40°F
A) 99.12°F
invNorm .93 = 1.476
1.476 * .62 + 98.2
Six pairs of data yield r = 0.444 and the regression equation y^ = 5x
+ 2. Also, y- = 18.3. What is the best predicted value of y for x = 5?
A) 27
B) 93.5
C) 18.3
D) 4.22
C) 18.3
The prizes that can be won in a sweepstakes are listed below together
with the chances of winning each one: $3800 (1 chance in 8600); $1700
(1 chance in 5400); $700 (1 chance in 4600); $200 (1 chance in 2600).
Find the expected value of the amount won for one entry if the cost of
entering is 55 cents.
A) $200
B) $0.91
C) $0.47
D) $0.44
D) $0.44
L1 = prize money & cost
L2 = corrosonding probability
(prob of 1 for cost
stat / calc / Run 1-var stats
answer is sigmaX (second line)
Find the standard deviation for the given sample data. Round your
answer to one more decimal place than is present in the original data.
203 122 237 230 181 220 132 155 153
A) 22.7
B) 46.1
C) 43.1
D) 40.7
C) 43.1
Use the given degree of confidence and sample data to construct a
confidence interval for the population proportion p.
n = 62, x = 19; 95% confidence
A) 0.190 < p < 0.422
B) 0.191 < p < 0.421
C) 0.209 < p < 0.403
D) 0.210 < p < 0.402
B) 0.191 < p < 0.421
Stat / Tests / 1-PropZInt
The principal randomly selected six students to take an aptitude
test. Their scores were:
77.0 75.1 75.6 81.3 88.4 77.4
Determine a 90% confidence interval for the mean score for all
students.
A) 74.89 < μ < 83.38
B) 83.28 < μ < 74.99
C) 74.99 < μ < 83.28
D) 83.38 < μ < 74.89
C) 74.99 < μ < 83.28
Use L1
then Stat / Tests / TInterval
An airline claims that the no-show rate for passengers booked on its
flights is less than 6%. Of 380 randomly selected reservations, 18
were no-shows. Find the P-value for a test of the airline's claim.
A) 0.1230
B) 0.3508
C) 0.0746
D) 0.1492
D) 0.1492
1-PropZtest
A random sample of 139 forty-year-old men contains 26% smokers. Find
the P-value for a test of the claim that the percentage of
forty-year-old men that smoke is 22%.
A) 0.1401
B) 0.1271
C) 0.2542
D) 0.2802
C) 0.2542
The total number of phone calls a sales representative makes in a
month is 425.
A) Discrete
B) Continuous
A) Discrete
A car insurance company has determined that 9% of all drivers were
involved in a car accident last year. Among the 11 drivers living on
one particular street, 3 were involved in a car accident last year. If
11 drivers are randomly selected, what is the probability of getting 3
or more who were involved in a car accident last year?
A) 0.070
B) 0.943
C) 0.424
D) 0.057
A) 0.070
binocdf
trials 11
p .09
x 2
.9305
1-.9305 = .0695
.07
A study conducted at a certain college shows that 59% of the school's
graduates find a job in their chosen field within a year after
graduation. Find the probability that among 6 randomly selected
graduates, at least one finds a job in his or her chosen field within
a year of graduating.
A) 0.995
B) 0.958
C) 0.590
D) 0.167
A) 0.995
binocdf
trials 6
p .59
x 0
.00475
1-.00475 = .99525
.995
Use the given data to find the minimum sample size required to
estimate the population proportion.
Margin of error: 0.005; confidence level: 99%; from a prior
study, p^ is estimated by 0.217.
A) 45,065
B) 225
C) 40,559
D) 26,109
A) 45,065
Za/2 for .99 = 2.576
(2.5762)*.217*(1-.217) =1.1274
1.1274/.0052
45096?
A laboratory tested 82 chicken eggs and found that the mean amount of
cholesterol was 238 milligrams with σ = 19.4 milligrams. Construct a
95% confidence interval for the true mean cholesterol content, μ, of
all such eggs.
A) 235 mg < μ < 243 mg
B) 233 mg < μ < 241 mg
C) 233 mg < μ < 242 mg
D) 234 mg < μ < 242 mg
D) 234 mg < μ < 242 mg
E = Za/2*σ/√n
E= 1.96*(19.4/sqrt(82)) = 4.1
238-4 < μ < 238+4
or Stat / Tests / ZInterval
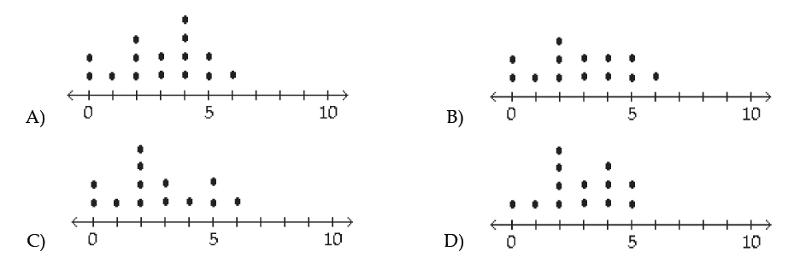
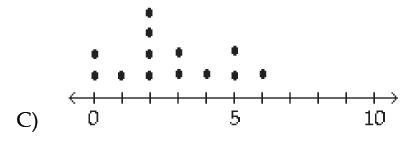
A manufacturer records the number of errors each work station makes
during the week. The data are as follows.
6 3 2 3 5 2 0 2 5 4 2 0 1
A department store, on average, has daily sales of $28,993.06. The
standard deviation of sales is $1000. On Tuesday, the store sold
$34,199.86 worth of goods. Find Tuesday's z score.Was Tuesday an
unusually good day?
A) 4.17, no
B) 5.47, no
C) 5.52, yes
D)
5.21, yes
D) 5.21, yes
($34,199.86 - $28,993.06)/$1000
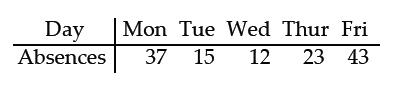
A company manager wishes to test a union leader's claim that absences occur on the different week days with the same frequencies. Test this claim at the 0.05 level of significance if the following sample data have been compiled.
H0: The proportions of absences are all the same.
H1: The
proportions of absences are not all the same.
Test statistic: χ2
= 28.308.
Critical value: χ2 = 9.488.
Reject the null hypothesis. There is sufficient evidence to
warrant rejection of the claim that absences occur on the different
week days with the same frequency.
X2GOF-Test
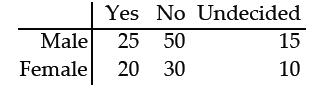
Responses to a survey question are broken down according to gender and the sample results are given below. At the 0.05 significance level, test the claim that response and gender are independent.
H0: Gender and response are independent.
H1: Gender and
response are dependent.
Test statistic: χ2 = 0.579.
Critical value: χ2 = 5.991.
Fail to reject the null hypothesis. There is not sufficient
evidence to warrant rejection of the claim that response and gender
are independent.
Various temperature measurements are recorded at different times for a particular city. The mean of 20°C is obtained for 60 temperatures on 60 different days. Assuming that σ = 1.5°C, test the claim that the population mean is 22°C. Use a 0.05 significance level.
H0: μ = 22;
H1: μ ≠ 22.
Test statistic: z = -10.33.
P-value: 0.0002.
Because the P-value is less than the significance level of α =
0.05,we reject the null hypothesis. There is sufficient evidence to
warrant rejection of the claim that the population mean
temperature is 22°C.
Assume that a simple random sample has been selected from a normally
distributed population. Find the test statistic, P-value, critical
value(s), and state the final conclusion.
Test the claim that the mean lifetime of car engines of a
particular type is greater than 220,000 miles. Sample data are
summarized as n = 23, x = 226,450 miles, and s = 11,500 miles. Use a
significance level of α = 0.01.
α = 0.01
Test statistic: t = 2.6898
P-value: p = 0.0066
Critical value: t = 2.508
Because the test statistic, t > 2.508, we reject the null
hypothesis. There is sufficient evidence to accept the claim that μ
> 220,000 miles.
Assume that a simple random sample has been selected from a normally
distributed population and test the given claim. Use either the
traditional method or P-value method as indicated. Identify the null
and alternative hypotheses, test statistic, critical value(s) or
P-value (or range of P-values) as appropriate, and state the final
conclusion that addresses the original claim.
In tests of a computer component, it is found that the mean time
between failures is 520 hours. A modification is made which is
supposed to increase the time between failures. Tests on a random
sample of 10 modified components resulted in the following times (in
hours) between failures.
518 548 561 523 536
499 538 557 528 563
At the 0.05 significance level, test the claim that for the
modified components, the mean time between failures is greater than
520 hours. Use the P-value method of testing hypotheses.
H0: μ = 520 hrs.
H1: μ > 520 hrs.
Test statistic: t
= 2.612.
0.01 < P-value < 0.025.
Reject H0. There is sufficient evidence to support the claim
that the mean is greater than 520 hours.